
This guest blog post was written by Trevor Parsons, PhD, Chief Scientist at Logentries, a cloud service for log management and analytics.
If you haven’t noticed already, Fastly provides extensive logging support including:
The ability to stream logs in real time to any of your favorite logging providers
TLS support, so you can be confident that everything is encrypted on the wire
Backup logs directly to S3 for additional redundancy
In short, Fastly makes it very easy for you to get access to your log data so that you can better understand how your content delivery network (CDN) is delivering your content. Fastly’s logging is also extensible and configurable, allowing you to modify what is logged as well as the format of the log messages.
This blog post will outline (1) how you can log additional data in your Fastly logs, (2) how to update your logging format so that it’s both human-readable and easily analyzed by your logging providers, and (3) how you can analyze and spot trends in your data.
Adding to Your Fastly Logs
It’s almost always a good idea to add additional data fields to your log events so that you can provide more context around what is going on across your environments. In particular, when debugging subtle issues, additional data points can be the difference between scratching your head and a “light bulb” moment.
Out of the box, Fastly will provide the following per log event: Client IP, Time Stamp, Request Type, Request URL, and HTTP Status Code. You can also include a lot more information via some of the VCL extensions:
Time and Date Variables: These variables include data that can provide additional flexibility when dealing with dates and times. For example, elapsed time will give you to ability to log how long a request is taking to process.
Size Related Variables: Request and response size can be added to your logs, including a breakdown of the header and body size.
GeoIP Related Variables: Fastly exposes a number of geographic variables based on the MaxMind DB, which you can include in your logs. These include continent, country, and city associated with the client IP, as well as the geographical region and POP location (i.e. city) of the data center the request came through.
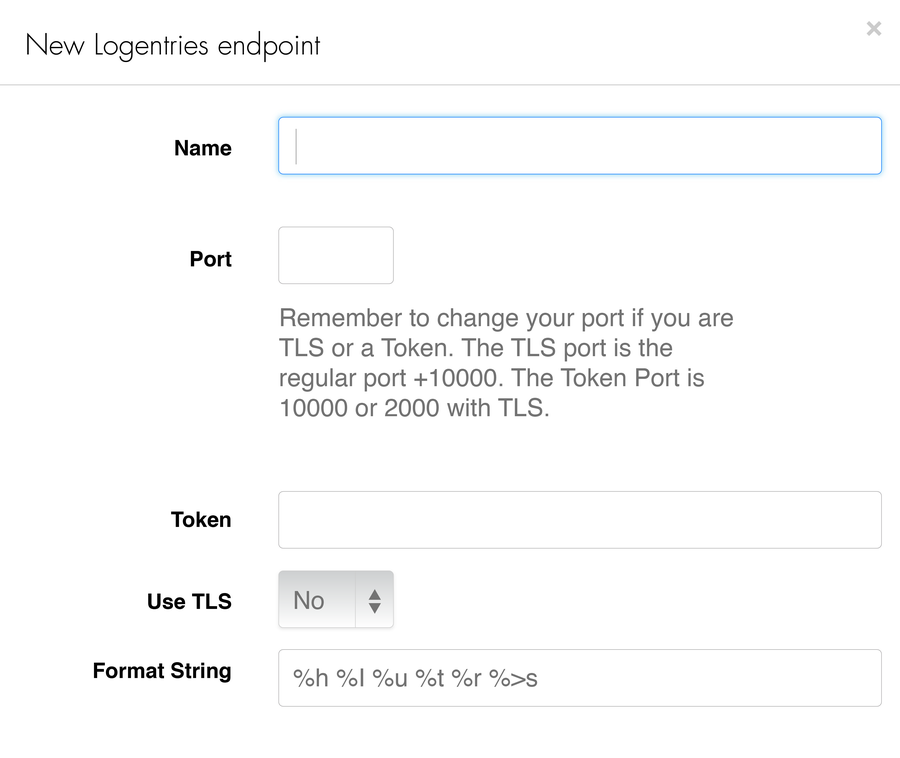
To enhance your logs with these additional data points, you can either update the format string field in your logging provider integration with these variables or you can modify the VCL file (see next section).
Modify the format string field to add additional data variables to Fastly logs
Modifying Your Log Format
There are at least two good reasons why you might want to update your logging format: (1) to make your logs more human-readable for when you need to review them, and (2) so that they can be easily analyzed by your logging provider. To solve for both (1) and (2), it’s often recommended to use either a JSON formatted log or to add Key Value Pairs (KVPs) to your logs. Most logging providers will support JSON formatted logs as well as KVPs, and will allow you to work with and easily analyze any field values in your events.
To modify your log event format in Fastly, update a custom VCL file with your modified events. Doing so is relatively straightforward and involves enabling custom VCL in your Fastly account and then uploading your custom VCL.
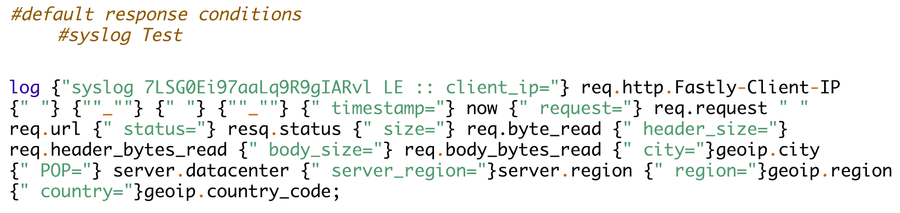
Extract from custom VCL with additional fields and re-formatted
You can easily modify the logging format to include your field names for feasibility and easy analysis, as seen below.

Fastly event with KVPs
Next, you can easily analyze your logs to work with field values, for example using GroupBy, Average, Sum, and Count, as shown in more detail below.
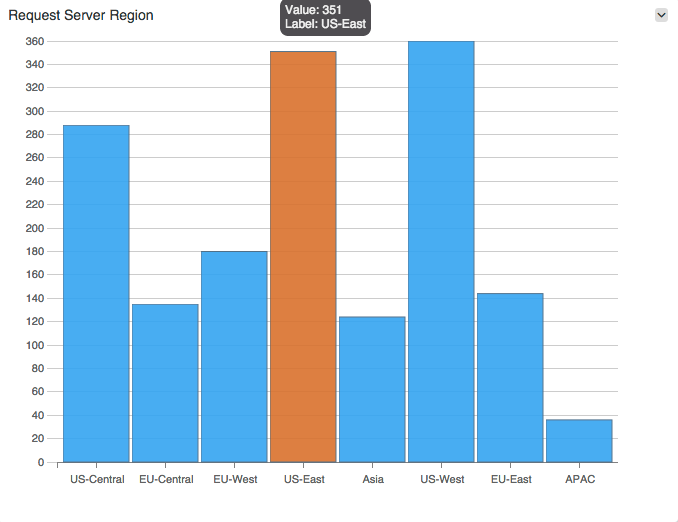
Requests by server region using GroupBy field value
Analyzing Your Fastly Log Data
You can use your logs in two modes: (1) retrospectively to review your system behavior, and (2) proactively, so that you can be notified when something important is happening.
Reviewing Your Logs – Queries and Graphs
Logging providers have moved beyond simple search, and while you can always search across your logs for that needle in the haystack, the real value in analyzing logs is when you begin to use your logs as data. This means pulling out important events from your logs via queries that identify the important fields and then allow you to perform different types of analysis on them.
Some common analysis that can be applied include:
Counts and unique counts: For example, when getting visibility into system throughput, you might want a total count of successful requests over a given time period. Similarly, getting a unique count of a given field value allows you get visibility into the number of unique client IPs. As one example, this can be used to get an idea of the spread of client requests.
Statistics: Taking a look at the average, sum, or spread of important values is always useful. For example, average and total response sizes will give you visibility into how much content is being downloaded and if there are any unusual spikes in who is accessing your content, which can often be interesting from a security perspective.
Grouping the results: Slicing and dicing your analysis by different parameters allows you to get a more granular view of data points -- for example, grouping the result set by IP address, server region, referrer URL, etc.
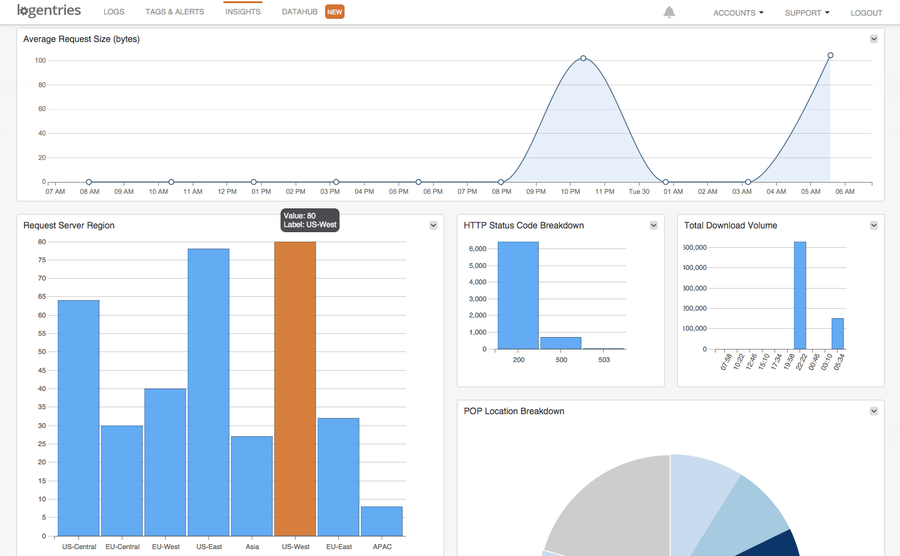
Example dashboard based on data from your Fastly logs
Getting Proactive with Real-time Notifications
The above analysis is always useful for looking back, but what if you want to look forward? Real-time alerting can be configured for your logs to notify you in a number of important situations:
Threshold breaches: Set thresholds when unacceptable bounds are breached by your system. For example, Fastly will provide the elapsed time for a request. If this begins to slow and breaches unacceptable levels, you can set up alerts (such as response_time>1s) that ping you when more than a given number of requests per second breach these bounds.
Inactivity alerting: Heartbeat checks have been long since used as part of monitoring frameworks like NAGIOS to make sure your servers and key services are up. The same approach can be taken to check the health of key ‘expected’ behaviors in your application. Inactivity alerting can be enabled on your Fastly logs to get notified when something doesn’t happen. For example, inactivity alerts can be used to check that people are making it to your sign-up page. If you usually get hundreds of sign-ups per day, and you have not seen any sign-ups for the last hour, there is a good chance that something is amiss in your system. Setting up inactivity alerts on key system behaviors that you expect to see captured by your Fastly logs allow you to get notified early when these behaviors are no longer occurring.
Change in behavior: A less obvious issue is when there has been neither any exceptions nor threshold breaches in your system but there has been a sudden shift in system behavior. These can be more subtle and difficult to spot, and requires the ability to specify a baseline of ‘normal’ behavior, as well as a deviation from the norm. Log management solutions that provide log-based anomaly detection allow you to be proactively notified when there has been a sudden change like this. Consider a response time example where you might deem it unacceptable if the time elapsed for a response were to breach 3 seconds. Anomaly detection allows you to identify a situation where no threshold breach has triggered, but response time may have gone from an average of 10ms per request to 2.5 seconds per request over the course of an hour. Again, this sudden shift in behavior is likely something you and the rest of the Ops team would like to know about. By learning when these types of trends start to appear, you are able to proactively react before the thresholds are actually breached, enabling you to rectify the situation before your customers start to complain.
If you’re interested in learning more about using log analysis and real-time data correlation of your Fastly log data, check out Logentries.