
This is the third in a series on Lean Threat Intelligence. Check out Part 1 and Part 2.
In “Lean Threat Intelligence Part 2: The foundation,” we explained how we built our log management system, Graylog, using Chef. Next, we’ll cover how we created a message pipeline that allows us to route messages to different endpoints for analysis or enrichment. The limitation with only hosting Graylog is that you need to set all of your hosts to send messages to the Graylog instance, and you can’t modify, enrich, or inspect any of these logs along the way. This blog post digs into how we addressed that problem by implementing a Kafka message queue, which was part of our original systems diagram:
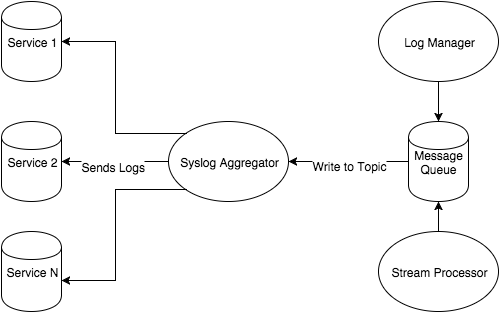
In this post, I’ll discuss why message queues are a necessary component for moving an immense amount of data into one centralized point. The Kafka message queue not only achieves this goal, but also helps Fastly search logs for indicators of compromise before they are placed in Graylog.
Message queues
Within the context of our systems diagram, a message queue allows us to centralize logs as messages into one service. Once in this service, you can see there are potentially many outputs. This has its advantages for our logging cluster setup:
Scalability: As log/message volume increases, we can add more nodes to bolster the message queue throughput.
Decoupling services: Messages can be sent or pulled from the queue. This central point of collection is attractive for consumers and producers of data because mostly everything has to rely on integration with the message queue, and you don’t have to create integrations with all your different services.
Logical pipelines: In regards the last point, there could be many parties interested in consuming a piece of data from your message queue. Some of these parties may also want to place an enriched or modified message back into the queue, while another service down the line wants that enriched piece of data. These pipelines are easy to understand if you keep returning back to the queue, instead of creating a confusing, complicated pipeline with many dependencies.
For more information on message queues, cloudamqp1 and IBM2 have good introductions.
After considering many message queue technologies, we decided on Kafka. Kafka has a decorated history of success at reputable companies3, but we chose it primarily for its publish/subscribe model4, log queueing strategy5, throughput6, and ease of integration with Graylog and other technologies that we use here. These features benefit the scale of Fastly and the sheer amount of data we want to process. Datadog7 has a fantastic introduction to Kafka and its features, but for now we are going to jump right into spinning up a Kafka node.
Deploying Kafka via Vagrant
Add the following lines (or make a new one just to play with Kafka) into the Berksfile from Part 2:
      cookbook 'apt'
      cookbook 'runit'
      cookbook 'apache_kafka'
      cookbook 'zookeeper', git: 'git://github.com/evertrue/zookeeper-cookbook'
We'll be using apache_kafka cookbook from upstream as well as the zookeeper cookbook from evertrue. This exposes enough recipes to start up a single node deployment of Kafka.
Add the following lines to your Vagrantfile:
    # -* -mode: ruby -*-
    # vi: set ft=ruby :

    Vagrant.configure(2) do |config|

      config.vm.define 'kafka01' do |kafka_config|
        kafka_config.vm.box = 'ubuntu/trusty64'
        kafka_config.berkshelf.enabled = true
        kafka_config.berkshelf.berksfile_path = './Berksfile'
        kafka_config.vm.network 'private_network', ip: '192.168.50.101'
        kafka_config.vm.provider 'virtualbox' do |v|
          v.memory = 512
        end
        kafka_config.vm.provision :chef_solo do |chef|
          chef.add_recipe('apt')
          chef.add_recipe('java')
          chef.add_recipe('zookeeper')
          chef.add_recipe('zookeeper::service')
          chef.add_recipe('apache_kafka')
          chef.json = {
              'apt': {
                'compile_time_update': true
              },
              'java': {
                'oracle': {
                  'accept_oracle_download_terms': true,
                },
                'install_flavor': 'oracle',
                'jdk_version': 8
              },
              'apache_kafka': {
                'scala_version': '2.11',
                'version': '0.9.0.0',
                'checksum': '6e20a86cb1c073b83cede04ddb2e92550c77ae8139c4affb5d6b2a44447a4028',
                'md5_checksum': '084fb80cdc8c72dc75bc3519a5d2cc5c'
              }
          }
        end
      end
    end
This will spawn one virtualbox vm on Ubuntu 14.04, update the machine via apt-get update, install Java, Zookeeper, and Kafka. Each Kafka node reports statistics such as node health, topic information, and consumer information to Zookeeper. If you want to read up on this relationship, please refer to Datadog’s writeup8.
Once your Vagrantfile and Berksfile are squared away, type vagrant up kafka01. Login via vagrant ssh kafka01 and run sudo netstat -apunt. You should see Zookeeper listening on port 2181 and Kafka on port 9092. Verify Kafka connectivity to Zookeeper by checking for an ethereal port on the local machine connected to port 2181.
    vagrant@vagrant-ubuntu-trusty-64:~$ sudo netstat -apunt | grep 2181
    tcp6       0      0 :::2181                 :::*                    LISTEN      15745/java
    tcp6       0      0 127.0.0.1:51867         127.0.0.1:2181          ESTABLISHED 15806/java
    tcp6       0      0 127.0.0.1:2181          127.0.0.1:51867         ESTABLISHED 15745/java
Reading & writing
Since Kafka is a log manager and a message queue, let’s send it some logs to be stored as messages. Kafka uses a paradigm called publish/subscribe with which you publish messages to a topic and subscribe to it to receive them. Topic creation can be automatic as a reader or writer connects to Kafka, but let’s create one explicitly.
First type sudo /usr/local/kafka/kafka_2.11-0.9.0.0/bin/kafka-topics.sh --create -topic test --replication-factor 1 --partitions 1 --zookeeper localhost:2181
Then type sudo /usr/local/kafka/kafka_2.11-0.9.0.0/bin/kafka-topics.sh --describe --zookeeper localhost:2181
You should see this:
    vagrant@vagrant-ubuntu-trusty-64:~$ sudo /usr/local/kafka/kafka_2.11-0.9.0.0/bin/kafka-topics.sh --describe --zookeeper localhost:2181
    Topic:test  PartitionCount:1  ReplicationFactor:1 Configs:
      Topic: test Partition: 0  Leader: 0 Replicas: 0 Isr: 0
The Kafka website9 explains this output perfectly:
Here is an explanation of output. The first line gives a summary of all the partitions, each additional line gives information about one partition. Since we have only one partition for this topic there is only one line."leader" is the node responsible for all reads and writes for the given partition. Each node will be the leader for a randomly selected portion of the partitions."replicas" is the list of nodes that replicate the log for this partition regardless of whether they are the leader or even if they are currently alive."isr" is the set of "in-sync" replicas. This is the subset of the replicas list that is currently alive and caught-up to the leader.
In order to interact with Kafka for both reading and writing, I like to use kafkacat. The command line consumer/producer can be buggy and kafkacat has a strong command line argument toolset to make interaction straightforward. The following snippet installs git, the necessary Kafka libraries, clones the code, builds it, and moves it into /bin.
    sudo apt-get install git librdkafka-dev libyajl-dev -y
    git clone https://github.com/edenhill/kafkacat.git
    cd kafkacat
    ./bootstrap.sh
    sudo mv kafkacat /bin
Write a JSON message to a file echo '{"msg":"foo"}' >> foo and then write it to your Kafka cluster kafkacat -P -b localhost -t test -p 0 foo. This specifies a broker on localhost, a specific topic (in our case, test), a partition, and a filename. To read messages off this topic, run kafkacat -b localhost -t test. The output should appear like so:
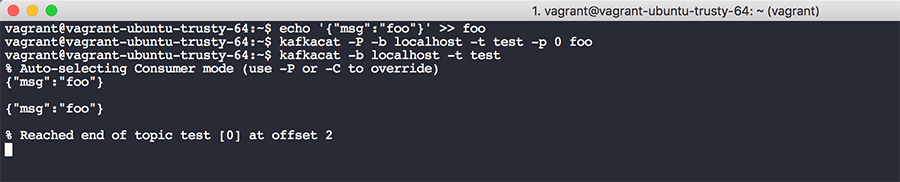
*Note: I have two messages in my topic as a result from testing, but each run of the first kafkacat command will place one message in the queue.
You'll see a few things from this output: the message(s) in the queue, starting from the first message at offset 0 all the way to the last message at offset N, where N is total number of messages produced into the topic. When you place a message into a topic it’s assigned an offset within the message queue. This might be confusing, because with a traditional computer science queue you don't typically track or care about offsets. As a Kafka reader, you can check into a topic at a given offset and begin reading from that offset. This mechanism helps prevent data loss and failure in the event of a service outage. Your consumer can be given an offset in the past and start working from that position all the way to the tail of the list. You can also theoretically store Kafka messages with a large retention period and perform forensics on the log data at some point in the future.
Kafka & Graylog
Kafka integration with Graylog is native, so you can immediately consume messages from Kafka topics with a new input and Graylog will handle it behind the scenes. To enable Kafka input, go to System -> Inputs

In the dropdown for "Launch new input," type in "Kafka," and you'll see three Kafka input types. Raw/Plaintext Kafka is what you want for now; select this option and fill in the Zookeeper servers with ports as a CSV list. Under "Topic Filter Regex," fill in the topic you want to read from and click launch. You’ll see Kafka messages come in by clicking "Show received messages," then you can inspect the message body and apply transforms to make the fields searchable.
Kafka & its uses in Threat Intelligence
This type of message queue has its benefits for Threat Intelligence programs — you can use it as an intermediary between your SIEM and different log collection endpoints. Log collectors produce data to a Kafka topic while your SIEM consume from those separate topics. This makes data search in your SIEM straightforward because you can hone your searches Kafka topics which can represent one type of log.
Secondly, the producer and consumer relationship within Kafka does not have to be 1-1. A topic can be read by many consumers. For example, you can set a Kafka topic called ‘ssh-logins’ that is consumed by your security department as well as your IT department. Both IT and Security has separate consumers that track their own offsets within the queue, and they can do whatever they want with the data they consume.
Lastly, you can use Kafka as an enrichment pipeline. By building off previous points, you can set up a pipeline of topics, consumers and producers that enrich data before it lands in a SIEM. Data enrichments might include adding IP reputation data, passive DNS, or file hash information gathered ahead of time based on free or commercial data feeds. Furthermore, Kafka consumers can read messages, process them, and then generate their own alerts by looking at statistical behaviors or cross-device messages. Fastly uses Kafka as an intermediary message queue between Graylog and other enrichment services. If you remember the systems diagram, we placed Kafka in between a "Stream processing" service and our Graylog log manager.
Using topics, we can create processing pipelines that continually enrich Kafka data until it reaches the end of a pipeline, which is just another Kafka topic that Graylog consumes. Consider this example pipeline:
WAF Logs -> Syslog -> Ship to Kafka -> Extract IP Address -> Enrich from Threat Intelligence Database -> Send back to Kafka -> Send to Graylog
A syslog message from a WAF log (a blocked User-Agent string log, for example) can be sent off to Kafka topic "waf-logs." A consumer can subscribe to "waf-logs" and use regexes to pull out IP addresses from that blocked log. That same consumer can query a database to enrich the WAF log with reputation context surrounding the User-Agent/IP combination. The consumer sends the enriched log to a separate topic, "enriched-waf-log," where Graylog can consume the log and add to its indexes. Lastly, Graylog can be configured to alert on any message consumed from “enriched-waf-log.” The record in Graylog will then have contextual and rich information surrounding the event, which makes it easier for the operations member to respond to the event.
Going forward: shipping logs into Kafka
Now that you’ve loaded the Kafka recipes loaded in your Berksfile and with the Vagrant definition of the Kafka box, you can enable Kafka inputs on your Graylog instance, as well as inspect data in Graylog and apply transforms to extract the messages to make them easily searchable in Graylog.
My next post will discuss how to ship logs easily from your syslog hosts into Kafka. Deciding how you want to get logs into Kafka can be an adventure within itself. Syslog plugins and code libraries exist to write data to a topic, but you also need to worry about the security of those logs when they’re in transit. Fastly makes use of Filebeat and Logstash to help ship and transform logs in a presentable format into Kafka. This allows our downstream Kafka consumers to extract relevant data from the logs to perform enrichment, which in turn makes searching easier in Graylog. Stay tuned!
References
1 https://www.cloudamqp.com/blog/2014-12-03-what-is-message-queuing.html
2 https://www.ibm.com/support/knowledgecenter/SSFKSJ_8.0.0/com.ibm.mq.pro.doc/q002620_.htm
3 https://cwiki.apache.org/confluence/display/KAFKA/Powered+By
4 http://kafka.apache.org/documentation.html#intro_topics
5 http://kafka.apache.org/documentation.html#uses_logs
7 https://www.datadoghq.com/blog/monitoring-kafka-performance-metrics/
8 http://kafka.apache.org/081/quickstart.html
9 http://kafka.apache.org/documentation.html#intro_distribution