
Due to the ongoing COVID-19 pandemic, ads leading up to the annual Black Friday - Cyber Monday holiday shopping weekend were remarkably devoid of the promises of “doorbuster” sales at the local malls and big-box stores. Instead, retailers moved their discounts and promotions to their ecommerce sites. With the weekend now in our rear-view mirror, we’ve either safely retrieved our purchases from curbside pickup, or are anxiously waiting for them to be delivered.
As we have moved even more of our lives online throughout 2020 we wanted to see how this behavioral shift impacted holiday shopping activity. Below, we examine aggregate traffic volumes (requests per second) for 100 of Fastly’s top* United States based ecommerce/retail customers over short- and long-term timeframes. We also look at traffic patterns for selected nonprofit/charities that deliver content through Fastly to observe activity heading into, and during, Giving Tuesday.
Key findings include:
Black Friday steals the digital spotlight: The highest-traffic shopping day of the “Cyber Five” was Black Friday, with peak ecommerce traffic clocking in at upwards of 30% higher than on Thanksgiving.
Cyber Week promos, deals, and discounts worked their magic: Peak ecommerce traffic on Black Friday and Cyber Monday was up 26% and 17% compared to the previous Friday and Monday.
Consumers were eager to shop earlier this holiday season: Media reports of early holiday shopping in 2020 are supported with an initial rise in traffic through the first half of October, and then a more steady increase through the month of November.
Nonprofits felt the love, too: Peak traffic to selected nonprofit/charity customers on Giving Tuesday was around 60% higher than Cyber Monday, as well as Tuesday a week prior.
By Day
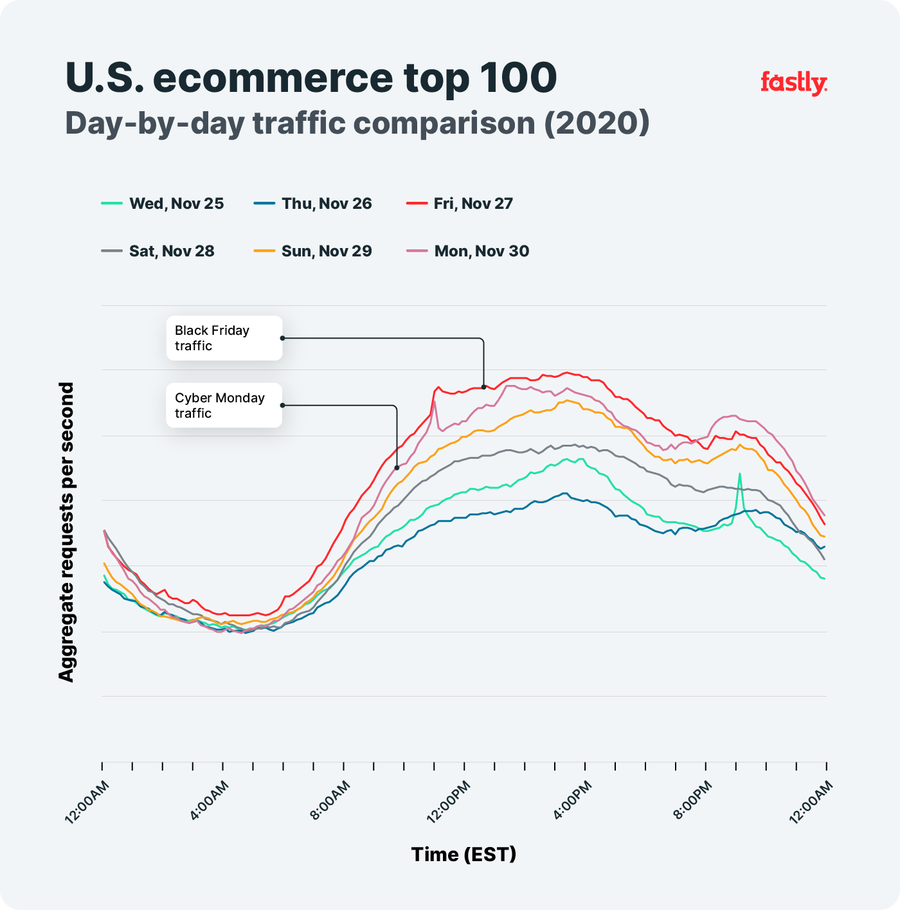
Comparing peak traffic levels during the days of the extended holiday weekend (Wednesday, November 25 through Monday, November 30), we observed that Black Friday saw the highest peak of the holiday weekend, with Cyber Monday the second highest, at just 3.4% below Black Friday’s level. Thursday had the lowest peak traffic level of the long weekend. Our guess? People were more focused on connecting with friends and family than shopping online. Peak traffic levels on both Black Friday and Cyber Monday were upwards of 30% higher than Thursday’s.
It is interesting to note that the daily traffic patterns during the holiday weekend remained consistent with the patterns observed before it, with peaks occurring around 3:00 pm Eastern. This would appear to indicate that the surveyed retailers didn’t offer time-bound discounts or deals that would have resulted in obvious, but time-limited, traffic spikes or traffic increases that started significantly earlier in the day.
Week-to-Week
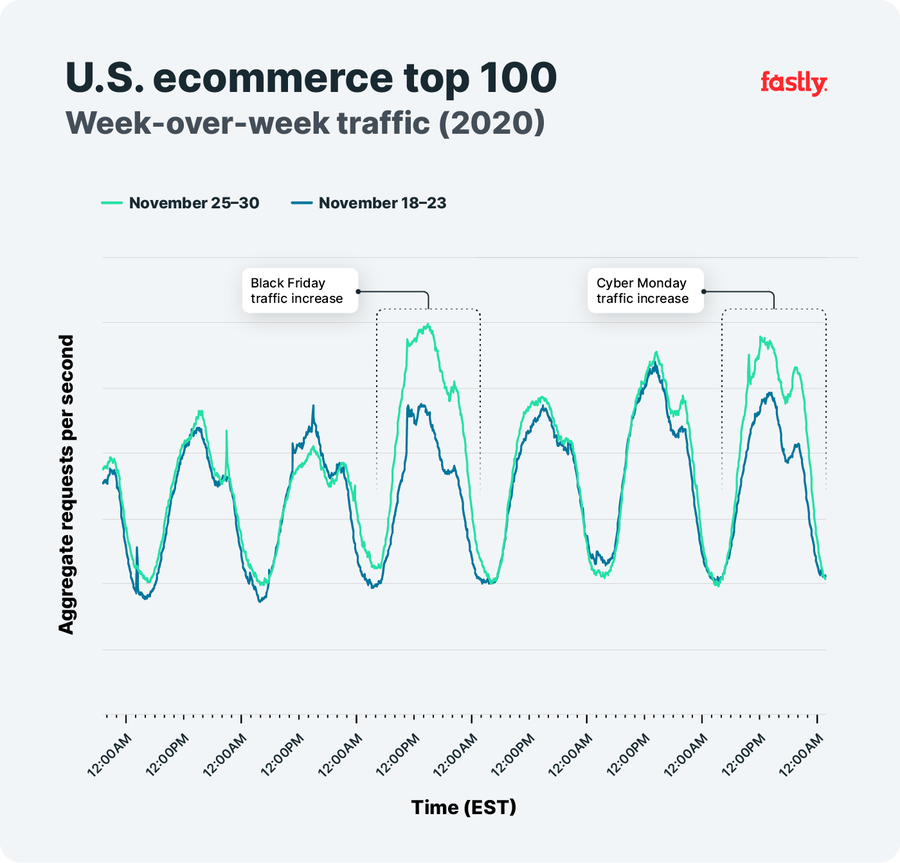
In comparing traffic patterns during the extended holiday weekend to those seen during the same days one week prior, several things stand out. As expected, the peak traffic levels on Black Friday and Cyber Monday exceeded those reached the previous Friday and Monday, with peaks 26% and 17% higher respectively. Thanksgiving’s peak was 8.3% lower than that of the preceding Thursday as families likely focused on celebrating instead of shopping. However, heading out of Thanksgiving day and into Black Friday, aggregate traffic across this customer set remained generally higher than during the same period the previous week.
Long-Term Perspectives
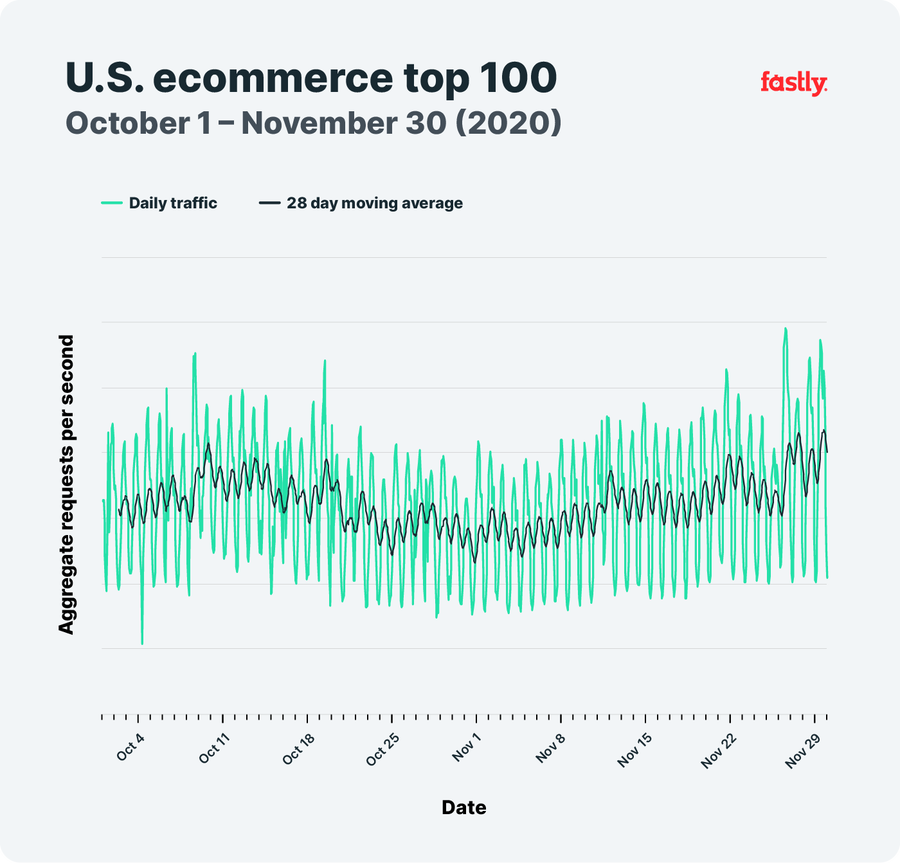
Media reports noted that “this year, shoppers started their gift buying earlier than ever.” Traffic patterns across the surveyed customer set during October and November appear to support this assertion with an initial rise through the first half of October, and then a more steady increase through the month of November, as many large retailers began promoting early holiday discounts. The Thanksgiving drop in traffic and subsequent Black Friday increase is clearly evident here as well.

In previous years, many rushed through their Thanksgiving celebrations to take advantage of so-called ‘doorbuster’ sales offered at both brick & mortar and online stores. However, after spending the last eight months almost entirely online, many took the opportunity this year to step away and focus on other pursuits instead of aggressively pursuing bargains on their favorite ecommerce sites. In comparing traffic trends for 2020’s holiday weekend to 2019, we can clearly see this change in behavior. Last year, traffic for ecommerce customers started to increase before Thanksgiving, grew rapidly into Black Friday, and then peaked on Cyber Monday. In 2020, traffic increased slowly through November, likely related to the early holiday sales offered by retailers. A clear decline in traffic is evident as Thanksgiving week begins, hitting the lowest point of that week on Thanksgiving day. As expected, traffic increased for Black Friday, which also saw higher peak traffic than Cyber Monday, as noted above.
Regional Notes
We also analyzed holiday weekend traffic for sets of top ecommerce customers across the Americas (U.S. and Canada, Mexico, and Latin/South America), EMEA, and Asia Pacific (APAC) regions. However, because Thanksgiving on the last Thursday of November and the associated shopping weekend remain largely a U.S. custom, we chose not to present detailed insights here, but instead offer some high-level observations:
Americas: Because the majority of this customer set comprises U.S. retailers, the traffic patterns and peak timing remained similar to that observed for the U.S. customer set. However, because it includes ecommerce sites based outside the U.S., but which see traffic from U.S. users, the differences in peak traffic levels from day-to-day and as compared to the previous week were more significant.
EMEA: The lowest peak day in this region was Saturday, not Thursday (Thanksgiving) as seen in the U.S. This observation is in line with the prior week’s traffic. While the highest peak was seen on Black Friday, it wasn’t significantly higher than the other days. During the previous week, the highest traffic days were Sunday and Monday.
APAC: In this region, the lowest peak traffic day was also Saturday, while the highest peak was seen on Wednesday. The traffic peaks on the other days of the holiday weekend were clustered, with nominal differences day-to-day. In looking at traffic from the prior week, the biggest difference was seen on Friday, with traffic patterns on the other days aligning fairly closely from week-to-week.
Giving Tuesday
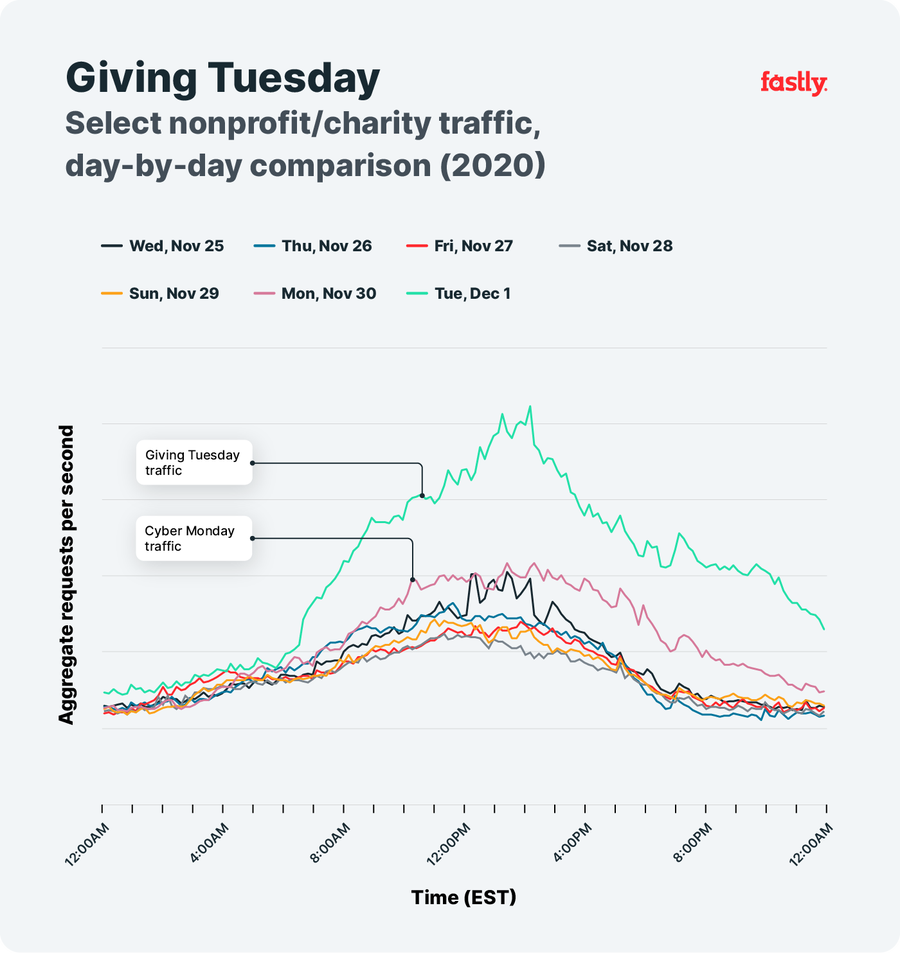
The day after Cyber Monday has become known as Giving Tuesday, with a shift in spending on retail goods and services to donations made to charities and nonprofits. Looking at traffic to a selected set of nonprofit/charity customers, it is clear that traffic increased on (Cyber) Monday, possibly as a result of early appeals for donations. But, Giving Tuesday’s peak was on the order of 60% higher than Monday’s, with traffic generally higher throughout the day.
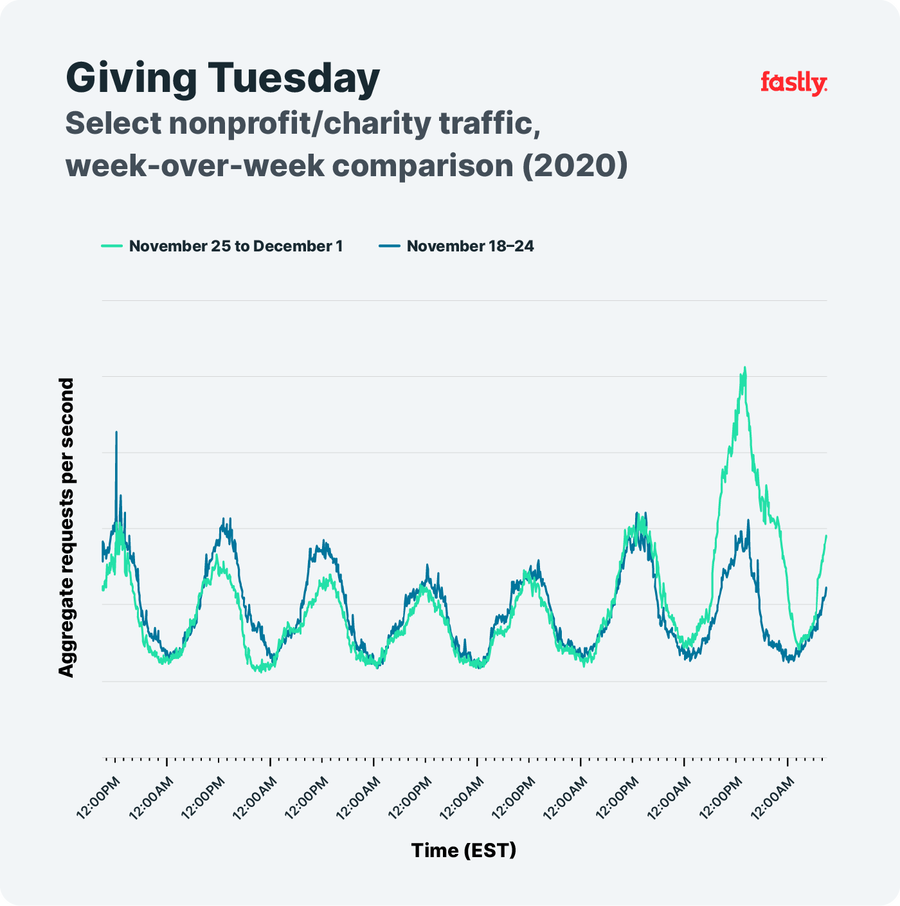
On a week-over-week basis, peak traffic was approximately 60% higher on Giving Tuesday than the previous Tuesday. Traffic for these organizations on Thursday (Thanksgiving) and (Black) Friday was slightly lower than the prior week. Traffic over the weekend and on Cyber Monday was roughly in line with the prior week.
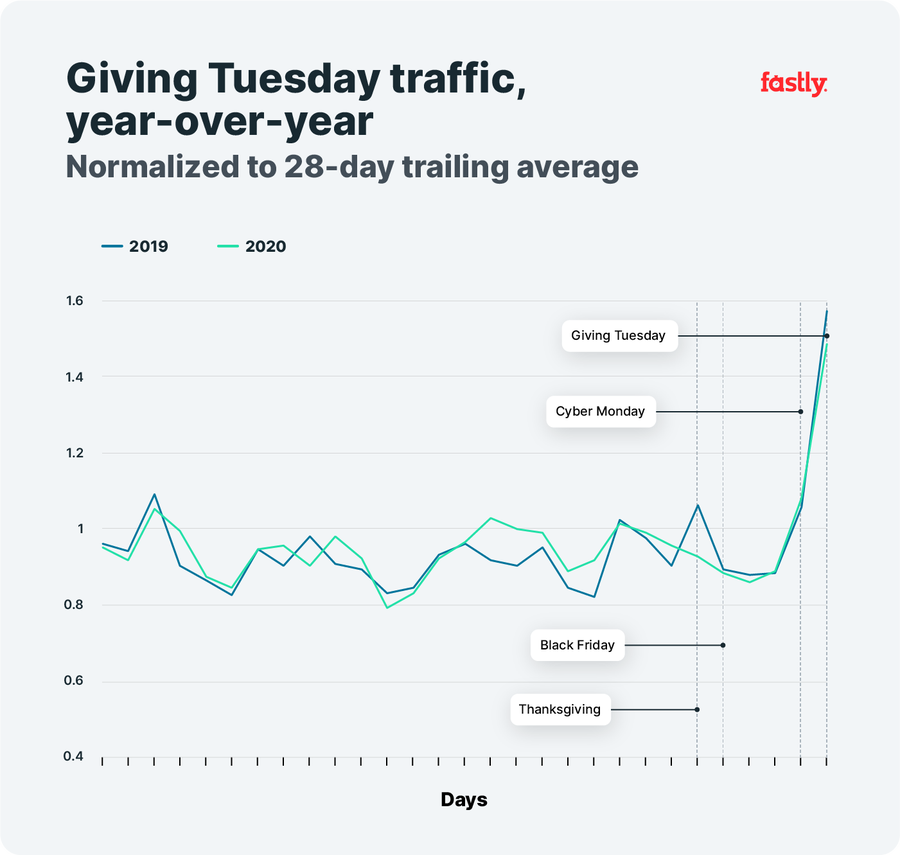
In comparing this year’s Giving Tuesday traffic to 2019, we can see that the growth in traffic from Black Friday to Giving Tuesday was nearly identical year-over-year. Interestingly, 2020’s traffic pattern for this customer set is very similar to 2019’s over the course of the preceding four weeks. The most notable difference is last year’s traffic spike on Thanksgiving - 2020’s Thanksgiving traffic decline is in line with the commerce customer traffic patterns noted above.
Conclusion
Despite pandemic-driven ‘Zoom fatigue,’ many of us relied on it (and similar tools) to reconnect with family and friends during the Thanksgiving holiday instead of traveling to celebrate with them in person. And though we may have been online to celebrate, analysis of traffic patterns from our top ecommerce customers appears to indicate that after we clicked “end call,” we logged off and waited for the Black Friday sales to begin (or had wisely completed our shopping earlier in the month to beat the anticipated “shipageddon”).
*By total traffic (GB) delivered through Fastly.