
Since caching is one of the primary services a CDN provides, one of the most common metrics for evaluating CDN performance is cache hit ratio (CHR). CDN customers have used it for years as a primary indicator of how well a CDN is serving their users and handling their traffic. It’s not uncommon to see “98% cache hit ratio” in a dashboard and become easily convinced that end users are getting the most out of the CDN.
But there’s much more to CHR than meets the eye and the metric we often hold so dear may not be telling us what we think it's telling us. So, I thought it’d be a good idea to dig into what CHR is actually measuring and how we may need new ways of calculating and evaluating it.
How to Calculate a CHR
For many years, CDNs have used the following formula to calculate CHR:
Where requeststotal is the total number of client requests received by the CDN and requestsorigin is the number of those requests that made it to the origin. Basically, this means if we send 100 requests to the CDN and only one of them leaves the CDN to reach the origin, we'd have a CHR of 99%.
The problem is that when we hear "99% cache hit ratio," we instinctively think that this means 99% of our users’ requests were served at the edge of the CDN, from caches closest to the clients that made the requests. The truth is that this isn't necessarily the case, and to understand why that is, we need to have a discussion about CDN architecture, cache hierarchies, and long tail content.
What is a good CDN Cache Hit Ratio?
A good CDN cache ratio score depends on the website, and a higher score does not necessarily mean "better". A static website could have a cache ratio of 95-99%, but a more dynamic website may see much lower numbers. Additionally, a miss ratio of one to five percent is ideal for any website.
How CDNs are built
I don't want to go into too much detail, and I certainly can't speak for all CDNs, but at the highest level, it goes without saying that a CDN is a distributed network of caching proxies. These proxies, and therefore their caches, are shared. They receive and cache requests across a large number of domains, all of them belonging to the CDN's customers. This means that the storage of each server is also shared. Since storage is finite, there's always some sort of algorithm that usually includes eviction models for management of that storage. While oft-requested objects will likely stay in caches longer (assuming they haven't gone past their freshness lifetime), objects requested less frequently are more likely to get evicted from a cache even if their Cache-Control headers say they should be cached longer.
But just because storage management causes a still-fresh object to be evicted from one cache server doesn't mean that it'll necessarily be evicted from the entire CDN and all its cache servers. CDNs usually have some sort of hierarchical model deployed, where if a server that the client is communicating with doesn't have the object in its [cache](https://www.fastly.com/blog/clearing-cache-browser), it'll likely ask a peer or a parent for the object before trying to fetch it from the origin. The problem is that the peer or the parent isn't always next to the server the client is connected to. So the time it takes to fetch the object and serve it to the client could suffer. This is better illustrated with a diagram:
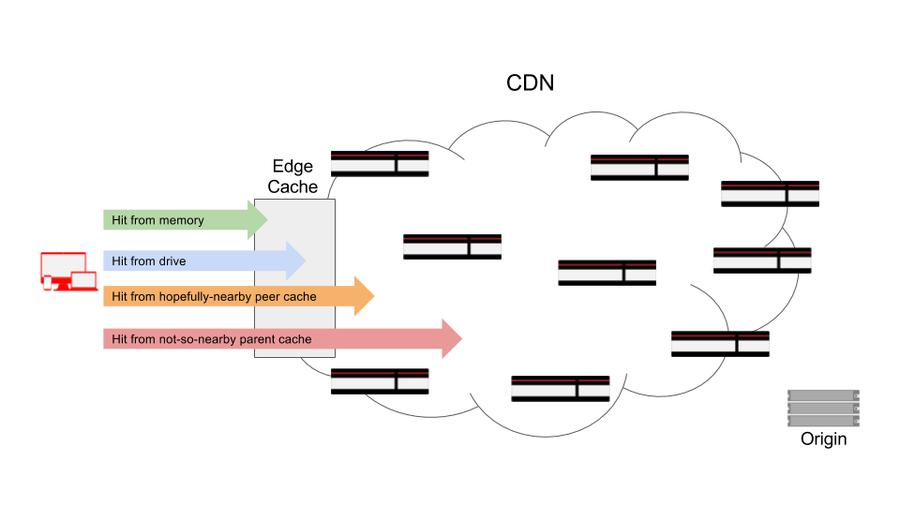
When an edge cache receives the request from the client, even though the TCP connection is between the client and that specific machine, the response can come from any number of possible storage locations, some not on the server at all. The object can be served from the memory of that machine (best case scenario), disk storage on that machine (let's hope that means an SSD because if it doesn't, there's an extra performance hit there too), a local peer/parent, or a not-so-local peer/parent. And the performance suffers respectively through that entire chain since the object is being served from farther and farther away from the network edge.
Where the object is ultimately served from is usually directly related to how often that object is fetched. The less frequently something gets requested, the higher the chance there is of it being a miss at edge cache the client is connected to. In other words, longer tail content (content not fetched very frequently, like social media posts, profile pictures, large ecommerce inventory, etc.) may still be served from the CDN, but not necessarily from a cache near the client.
But most CDNs consider any response from one of their caches a "hit" when they calculate CHR, as long as it didn't make it to origin. This is where CHR, as a metric, can be misleading and give you a false sense of the performance a CDN is providing for your customers. This is also where the object storage model of a CDN becomes crucial. If deployed without enough edge density, without proper scaling at the edge, and/or without optimal eviction algorithms, a lot of your long tail content may be getting served from deep within a CDN, while your CHR appears to be high.
A better way of calculating CHR
What the traditional CHR calculation is or isn't telling us necessitates a rethinking of how we should be calculating the metric we care so much about. To provide an indicating metric for performance, what we really want to know is the percentage of objects that were served from a CDN cache at the very edge of the network. Something more along the lines of:
Which is really the same as:
Where hitsedge and missesedge are the number of cache hits or misses at the edge of the network, respectively. This formula for CHR accurately conveys what percentage of cacheable requests is being served from the edge of the network, closest to the users.
To be honest, the traditional calculation is still extremely useful. It’s a very good metric for measuring server offload since it tells us what percentage of requests are kept away from the origin. But, to evaluate performance, we really care about what’s happening at the edge. The best way forward, then, is to consider two different CHR metrics, one for CHR at the edge:
And one for global CHR:
CHRedge is a performance metric and CHRglobal is one for offload. They’re both valuable and insightful, but they’re telling different stories. You should use CHRedge to gauge how much of your content is being served from the edge of the network, closer to your users. This translates directly to performance benefits. CHRglobal, on the other hand, will tell you how much traffic is kept off of your origin. This translates directly to processing and infrastructure offload, which can lead to great cost savings.
Calculating cache hit ratios with Fastly
Fastly's network is built in a way where every one of our points of presence (POPs) is an edge location, all of which you can see on our network map. For scale and storage density, we have layers of cache hierarchy within each POP, transparent to you and your end users’ requests. This means that even if a request is a cache miss at the server the client is connected to, there's a good chance it'll still be served from a cache inside the POP it’s communicating with, making it a cache hit at the edge. You can also deploy shielding for an extra layer of caching to increase your global cache hit ratio and reduce traffic to your origin.
The CHR that’s reported to you via the control panel or through the stats API is calculated as:
With services that have no shielded origins, this is effectively equivalent to both CHRedge and CHRglobal since every hit is a hit at the edge and every miss is a miss at the edge (and also a request to origin).
If your service has a shielded origin, where the shield POP adds another level of caching, the formula above still holds, but the hit/miss count will include hits and misses that were shielded. In other words, some requests will count twice. So, it’s a hybrid metric. There are a couple of different ways to decouple and calculate CHRedge and CHRglobal independently for a shielded service, but I usually prefer to do it using our real-time log streaming.
The following VCL snippet sets up log streaming for CHR calculation with a couple of local variables:
sub vcl_log {
#FASTLY log
  declare local var.cache_status STRING;
  declare local var.request_type STRING;
set var.cache_status = if(fastly_info.state ~ "HIT($|-)", "HIT", if(fastly_info.state ~ "PASS($|-)", "PASS", "MISS"));
set var.request_type = if(req.http.fastly-ff, "shield", "edge");

log {"syslog req.service_id logging_endpoint :: "} var.cache_status "," var.request_type "," server.datacenter;
}
Here, the local variable cache_status will have one of three possible values: HIT, MISS, or PASS. We want to exclude PASSes in our calculation since they’re not cacheable objects to start with. The local variable request_type will tell us if this request was served from a shield POP or an edge POP (or a shield POP communicating directly with a client rather than with another Fastly POP, functionally making it an edge POP for that request). Then, we log cache_status, request_type, and server_datacenter, which is the three-letter POP code.
From this VCL, our log entries will look something like this:
Jan  7 23:15:26 cache-sjc3131 logging_endpoint[218999]: HIT,edge,SJC
Jan  7 23:15:33 cache-sjc3638 logging_endpoint[348011]: HIT,edge,SJC
Jan  7 23:15:40 cache-iad2120 logging_endpoint[342933]: MISS,shield,IAD
Jan  7 23:15:40 cache-sjc3644 logging_endpoint[341583]: MISS,edge,SJC
Jan  7 23:16:07 cache-iad2127 logging_endpoint[342933]: HIT,edge,IAD
Jan  7 23:16:24 cache-iad2127 logging_endpoint[14817]: MISS,edge,IAD
Jan  7 23:16:40 cache-iad2120 logging_endpoint[218999]: HIT,shield,IAD
Jan  7 23:16:40 cache-sjc3624 logging_endpoint[438579]: MISS,edge,SJC
Jan  7 23:23:25 cache-iad2122 logging_endpoint[342933]: PASS,shield,IAD
Jan  7 23:23:25 cache-sjc3140 logging_endpoint[348011]: PASS,edge,SJC
Then, calculating CHRedge and CHRglobal from these log lines is pretty simple:
Where:
hitedge is a log entry with
cache_status = “HIT”andrequest_type = “edge”missedge is a log entry with
cache_status = “MISS”andrequest_type = “edge”
Likewise:
Where:
missshieldPOP is a log entry with
cache_status = ”MISS”andserver.datacenter = <your_shield_pop>hitedge is a log entry with
cache_status = “HIT”andrequest_type = “edge”missedge is a log entry with
cache_status = “MISS”andrequest_type = “edge”
Using the sample log entries from above as an example — which has the origin shielded at our Dulles, VA (IAD) POP — we’d calculate the following:
And:
Which provides a simple, yet good example for why the two metrics are indicating different things and should be evaluated separately.
While log streaming makes it easy to decouple the two metrics for shielded services, we’re working on making it even easier by reporting the metrics independently through our stats system in the not-so-distant future.
Going forward
At Fastly, we talk a lot about doing things at the edge and why that’s good for your end users. Caching remains one of these core functions and you should never lose sight of how well a CDN is caching your content at the edge. To this point, it’s important to understand how CDNs report cache hit ratio and what it means for your content and your end users’ experience. Calculating cache hit ratios both at the edge and globally is a great way to truly get a sense of how your content is being served.