
In an earlier post, we discussed the meaning of cache hit ratio (CHR) and analyzed what the metric is and isn’t telling us. We also showed why we really need two different CHR metrics (CHRedge and CHRglobal) to fully understand how a CDN is serving your clients. In this post, I want to dig more into CHRedge and discuss the impact of CHRedge on end-user performance. So, buckle up, we’re gonna do charts and graphs!
Your CDN is probably providing you a CHRglobal metric by default. But, you should expect your CDN to either give you both metrics or give you the means to easily calculate them yourself. Even if that’s not the case, there are ways to test for CHRedge that are, obviously, not as good as real user traffic metrics but should provide a good enough indication of how well your CDN is handling seldom-fetched, or long tail, cacheable content. So, our analysis of CHRedge here will come by way of a discussion about performance measurement via testing.
The fallacy of common CDN performance testing
The most common way of testing CDNs for performance has always been to use a network of distributed test nodes and fetch the same object over and over again to analyze its response time over some test period. It used to be that most testing tools only tested from “backbone” nodes, where the test node was deployed in some big data center, sometimes right next to the CDN cache server. This obviously didn’t reflect real-world performance from a user perspective. And even though most third-party testing services still have backbone testing as a core feature, some have moved on to offer either network throttling or “last mile” test nodes (i.e. behind real end-user internet connections). There’s also been an emergence of RUM-based tools, using crowdsourced data collection through JavaScript tags deployed on pages, producing large volumes of real user measurements, which is even better.
However, even though we’re now collecting data in more realistic conditions, we still insist on testing the same object over and over again. In fact, it’s extremely common practice to pick an image from the home page and feed that into the testing network to fetch repeatedly. So, it’s likely that the object is pretty hot to start with — and even if it isn’t, it’s likely that the volume of testing will turn it into a hot object.
In my previous post we talked about how CDN caching models tend to keep the hottest objects closer to edge. If we keep testing a very hot object, then what we’re really testing is the CDN’s footprint and not the CDN’s ability to cache and serve as much as possible from the edge, especially with large working sets and long tail content. So, this style of testing isn’t really testing content representative of your collective web assets and will seldom, if ever, give you an idea of your end-users’ overall performance experience in the real world. In other words, you think you’re testing how well a CDN will perform for all your content across all your apps, but what you’re really testing is the CDN's ability to serve a single, very hot object. Needless to say, those are two very different things!
Testing for cache hit ratio at the edge
I’ve done a couple of talks about the various mistakes some people make when measuring CDN performance, and in those talks I delve into a lot of these issues in detail. I don’t necessarily want to do that here, but I think this is a good point in the discussion of CHRs to see how proper testing can shed some light on how a CDN can actually perform for your content, across your entire working set.
One of the ways we test for this is by using the testing suite from our friends at Catchpoint. Specifically, we use Catchpoint’s “Last Mile” nodes which are essentially test machines deployed into homes, sitting behind real routers and real internet connections, testing while normal user traffic is flowing to and from the internet. This makes the tests experience a real user environment with normal bandwidth and latency constraints, yielding more realistic performance data than any testing with backbone nodes.
Using real-world conditions for testing is a must, but it isn’t enough on its own. Instead of testing the same object over and over again, we test a number of different objects, at varying frequencies. And the object being fetched is unique to the test node, so there’s no danger of one test priming the cache for another. The idea is to really understand how a CDN performs when something cacheable is fetched infrequently, which should expose how well objects are cached at the very edge of the network. If the CDN performs well across all test frequencies, that means caching at the edge is good for most content and we should expect a high CHRedge with real user traffic. If performance drops as the time interval increases, it means objects are falling out of the cache at the edge of the network more often and CHRedge would not be as high across large working sets.
We test at lots of different frequencies, but for this discussion I’ll show the results for:
A very hot object, similar to what conventional testing would use. This also sets a good baseline.
An object fetched once every 6 hours.
An object fetched once every 12 hours.
An object fetched once every 24 hours.
All objects have very high time to live values (TTLs) set through Cache-Control headers, so they’re not supposed to be expiring from the caches during the test.
Let me pause for a second here and say that all the data below is based on lots of testing through multiple CDN vendors, including Fastly. My point here isn’t to bash any CDNs. My only goal is to show how performance is impacted if a CDN caches less at the very edge of the network. So, I’m presenting all the data anonymously and won’t talk about which numbers belong to which CDN — though I’ll point out which results belong to Fastly.
Here are some details about the data we’re about to discuss:
All charts represent about three weeks worth of data.
Each test fetches a 1KB small object. The metric being analyzed is time to first byte (TTFB), which is measured from the time the request is sent (after the TCP connection is established) to the first byte of the response. TTFB is the right metric to use to see how quickly the CDN is capable of serving a cached object. The larger the TTFB, the farther away from the edge the test object is being served from.
The results here are generated by roughly 60 testing agents in the US. Each agent fetches the hot object once every 15 minutes. The other objects are fetched at the indicated frequency.
I won’t show all the data here, but here are a couple of CDNs that don’t seem to handle long tail content as well as they handle super hot objects:

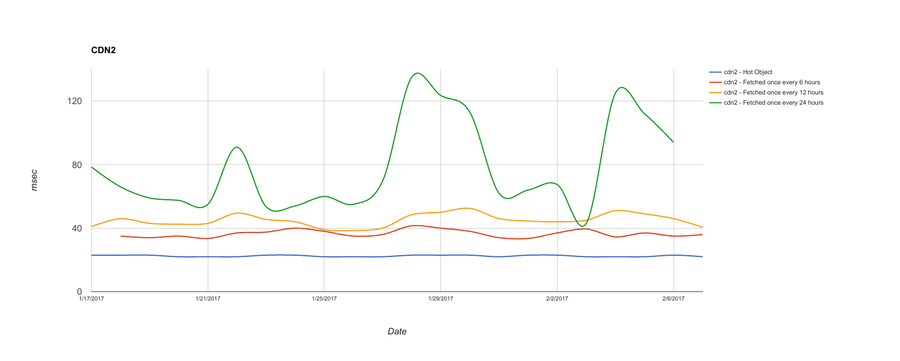
In these charts, the data is being aggregated and the daily medians for TTFB are being plotted for each fetch frequency. We can see that CDN2 does slightly better than CDN1 for objects fetched every 12 hours, but suffers the same way as CDN1 for objects fetched once every 24 hours.
In this case, for both CDN1 and CDN2, the TTFB of the object is adversely affected the less frequently it’s fetched by the test clients. A very hot object performs pretty well, and consistently, most frequently being served from the very edge of the network. But as the frequency of tests drops, so does the performance, meaning that either the longer tail objects are being served from deeper within the network, or are missing any cache altogether. This would potentially lead to a poor CHRedge in the real world if the working set is large and objects are fetched infrequently. This is regardless of how this CDN would do if we were evaluating CHRglobal since that metric only measures what does or doesn’t make it to origin. In other words, all these objects may, in fact, be served from a cache in the CDN. But that doesn’t necessarily mean they’re equally performant.
By contrast, here are two CDNs, across the same test nodes and time period, that do a better job with long tail content:

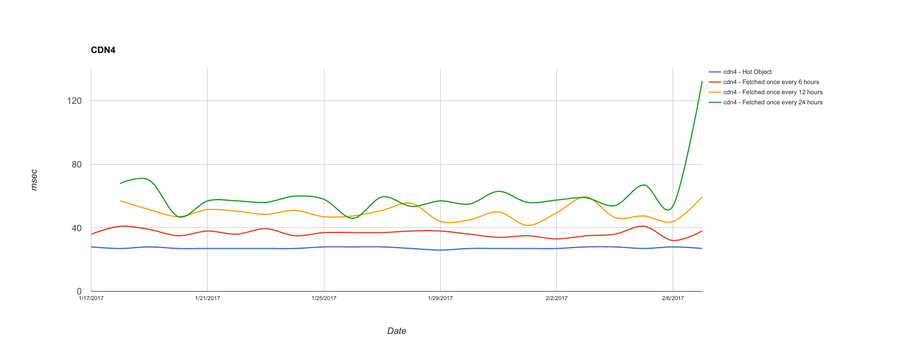
Both CDN3 and CDN4 do just fine for hot objects. And they both do better than CDN1 and CDN2 for long tail content. CDN3, though, does better for 6- and 12-hour fetch frequency while showing very erratic results for objects fetched once every 24 hours. CDN4 is much more consistent at 24-hour fetch frequency, but does incrementally worse as the time between client requests lengthens.
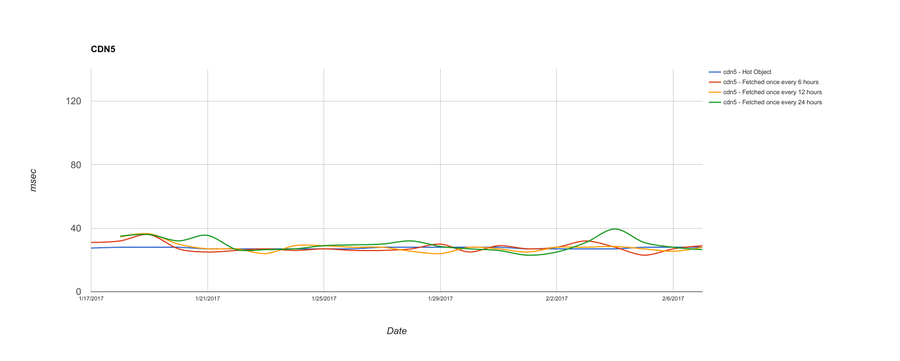
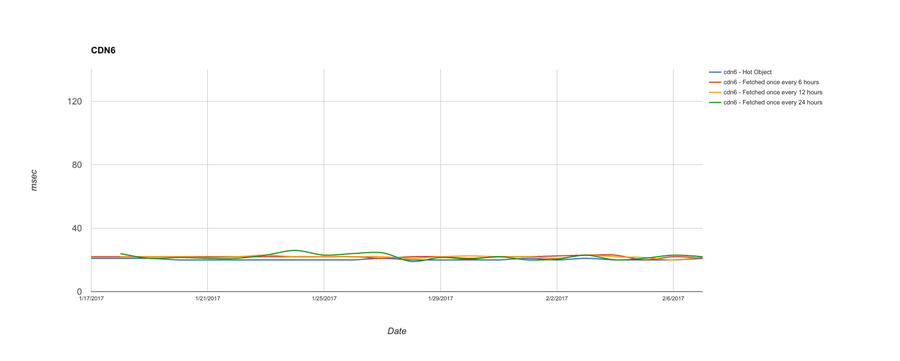
And finally, here are three CDNs that do very well for serving all objects, regardless of how frequently they’re fetched:
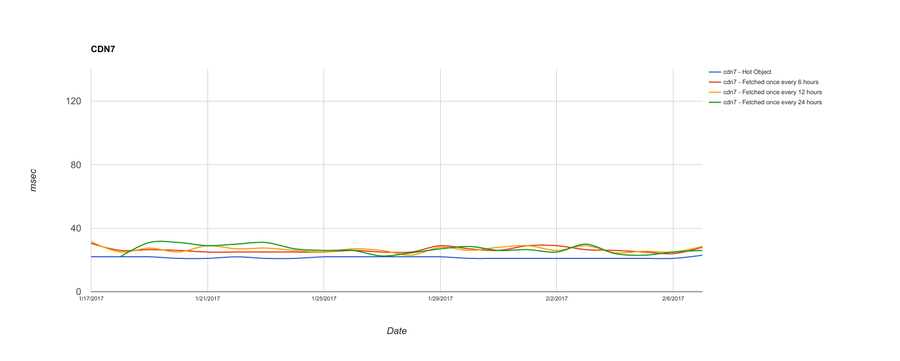
I know, that’s a lot of graphs! Let me distill it down a bit. Here’s an aggregate chart with all CDNs. What we’re showing here is the median TTFB across the entire three weeks’ worth of data, rather than daily:
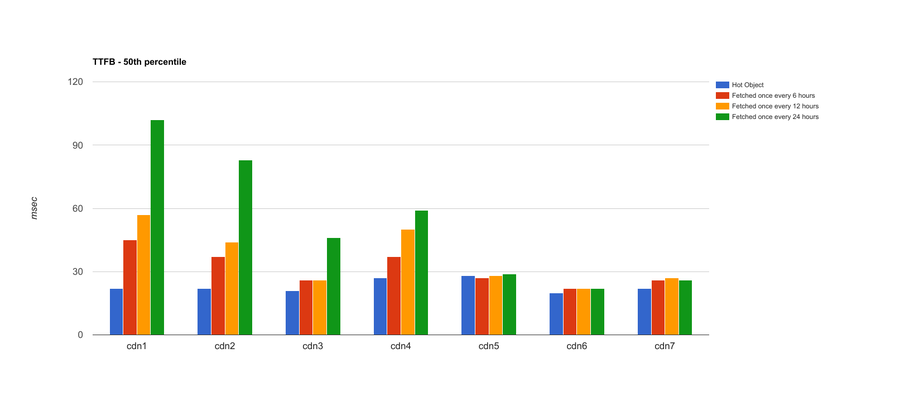
To put these test results in context, CDNs 1 and 2 would likely have poor CHRedge, CDNs 3 and 4 would do better, and CDNs 5-7 would have the best ratio of objects served from the very edge of the network. In all these cases, a CDN may report a high CHRglobal. But, CHRedge would diverge significantly from CHRglobal in the case of CDNs 1 and 2, while CHRedge and CHRglobal would be pretty close for CDNs 5-7.
That’s an analysis of median (or 50th percentile) TTFB across all the data points: 50% of the tests performed at the indicated TTFB or better. Things get slightly more interesting if we look at the 95th percentile for each CDN across the entire dataset:
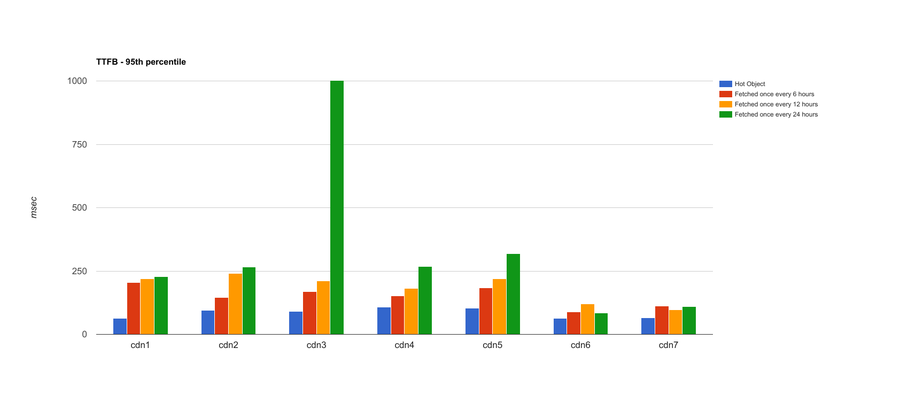
The stories for CDNs 1-4 stay pretty much the same, though CDN3 struggles at the 95th percentile with objects fetched once every 24 hours. CDN5 loses some of its luster; at the higher percentile, its performance isn’t as good as it is with medians, and fetch frequency seems to adversely affect TTFB. CDNs 6 and 7 still have strong showings even at the 95th percentile. This means we can expect much more consistent performance from CDNs 6 and 7, regardless of fetch frequency.
The 99th percentile exposes a bit more too:
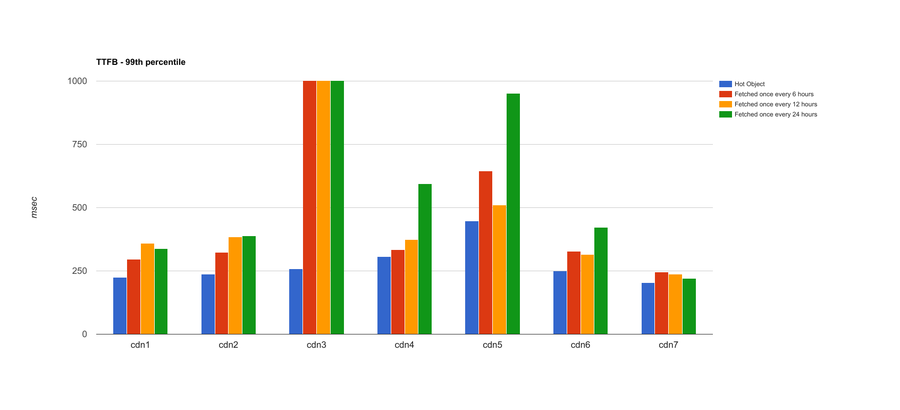
Looking at the 99th percentile is essentially the same as isolating the slowest of the response times from the entire dataset. Here, we see that CDN3’s slowest responses for 6-, 12-, and 24-hour test frequencies are all poor. We also see more inconsistencies from CDNs 4 and 5, and CDN6 is now starting to show some greater variance. Like the 95th percentile, but more so, the results at the 99th percentile tell us about the consistency we can expect across a wide variety of user requests. In this case, CDN7 is the one that shows the most consistency and least variance across the entire dataset.
All these results and how they illustrate the impact of fetch frequency on performance are a great showcase for why CHRedge is important to understand and measure. Depending on your working set, how a CDN performs may vary greatly depending on how frequently assets are being requested by your users.
Performance is often a nuanced science. In this case, framing the problem statement pragmatically yields to slightly unconventional testing that hopefully gives you the right expectations when it comes to what your users should be experiencing as they use your applications.
Putting it all together
We’ve covered quite a bit in our analysis of cache hit ratios here and in my last post. We discussed why we need two different CHR metrics to fully understand how a CDN is serving your customers. Digging into CHRedge as an important indicator of performance, we covered why common testing methodologies will likely not be a good proxy for what your users can expect across all your content and all your applications. Then, for a more compelling story, we showed results from tests that expose what sort of CHRedge you can expect from some CDNs by testing them for both hot and cold cacheable content.
It’s easy to get bogged down in numbers, pretty charts, and constant performance analysis; I do it all the time. But we have to remember that all of this is just one piece of a much larger picture. Of course you should expect great performance from your CDN, for all of your content and applications. But we can’t lose sight of the fact that a CDN should also be a part of your application stack. You should interact with it programmatically, in real time. You should have full visibility, in real time. Your CDN should secure your applications while running complex logic at the edge of the network. These are all characteristics of a CDN that truly allows you to not only deliver your content but also scale your application to the edge of the network, close to your users. It’s a whole package, and performance, with all its nuances, is just a piece of that package — albeit a significant one.
(Oh, and Fastly was CDN7.)