
We’re constantly monitoring our CDN’s performance from as many locations and network providers around the world as possible. Monitoring performance matters — not just for your servers and network gear, but also in terms of emulating and understanding the end user experience.
While there are various tools for monitoring performance, I’ll be focusing on Catchpoint in this post. However, these principles can apply to any third-party performance monitoring (TPM) vendor you use.
What Are End Users?
End users are the individuals or entities who directly interact with and utilize a product, system, or service for their intended purposes. They represent the final consumers or beneficiaries of a particular technology, software, or solution. End users can range from individual consumers using personal devices to businesses or organizations using complex software applications or hardware systems.
Ultimately, end users play a vital role in shaping the success and adoption of a product or service. Their feedback, usage patterns, and satisfaction levels provide valuable insights for improving and refining the offering to better align with their expectations and deliver the intended value.
Why should you measure performance?
Performance is vital to virtually every industry that has a presence on the web. The way your users interact with your site or mobile application directly affects conversion and end-user happiness. One example is Marissa Mayer’s Google experiment: she increased the number of Google search results to 30, and Google’s traffic and revenue dropped by 20%. Why the drop, especially when users had specifically asked for more results? After investigating, Mayer found that increasing the results also increased page load times from .4 seconds to .9 — half a second delay caused a 20% drop in traffic, and directly contributed to user unhappiness.
The bottom line is that your users value performance, which is why you should be keeping tabs on it.
Monitoring: Availability versus performance
Monitoring availability is key to ensuring your infrastructure is up and running, but it doesn’t give you insight into your end users’ experiences.
When monitoring your infrastructure’s availability, you’re making sure your storage capacity is sufficient, network ports aren’t at capacity, servers aren’t overloaded, and all your infrastructure components are healthy. You focus on the infrastructure metrics themselves, and tend to evaluate the outcome with binary measurements: the server is either running or it’s not, the server needs more RAM or it doesn’t, a new network port from your ISP needs be ordered or it doesn’t, etc. Viewing these metrics internally results in a rather myopic perspective of your environment that lacks synthetic or real user measurement. It also tends to be primarily used to react to urgent situations (for example, when something is down), and lacks historical insight and reporting tools.
Monitoring performance, on the other hand, emulates what the user is seeing, leading to a deeper understanding of user and browser or application behavior. Monitoring availability limits you to internal insight; monitoring performance gives you a view into a globally diverse, synthetic or real user base and their browsers that tell a more complete story. You’re also able to glean valuable transactional insight and evaluate historical trends, giving you the opportunity to evolve and adapt effectively.
How third-party monitoring tools help improve visibility
TPM tools give you a global user perspective, including network diversity in addition to geographical distribution, the ability to run complex queries across your data, insight into how each piece of the transaction performed, and the ability to emulate many types of endpoints — all of which can also be combined with your own data.
These tools also give you the historical data needed for correlation to important events (like a new release of your software), and potentially app-level insight into what’s going on inside your stack. TPMs let you conduct effective A/B testing and allow you to keep a close eye on your vendors and partners — for example, some partners you may have embedded on your homepage don’t always capacity plan properly, and therefore don’t always have your site’s performance as their highest priority.
In fact, we encourage all of our customers to track Fastly’s performance — it’s important that you know how all your vendors are performing, especially your CDN.
Key components to performance monitoring
Here are some of the main monitoring aspects you should be paying attention to:
DNS Lookup. DNS is the root of almost every single web transaction. In the case of a Fastly customer, this process would consist of the test agent doing a DNS lookup from its upstream resolver, to which the resolve would respond with a CNAME or A record, depending on how the customer is set up with Fastly. Typically, we end up giving the customer one or more A records. Ideally, the authoritative DNS provider (Dyn is our authoritative) receives these requests in a geographically near location and gives the requesting client the correct IP address of the closest server. If you outsource your authoritative DNS (hopefully, most of you use NSOne, Dyn, Verisign, etc.), any improvements or issues are mostly on their shoulders, so keep on top of them. If you run your own authoritative DNS servers, you should distribute these servers globally and learn how to run an Anycast network (no trivial task). One related discussion here is how DNS times in third-party tools are “over-weighted” compared to the real world, but that’s for a later post.
Connect. This is essentially the end-to-end establishment of a network session and initial TCP session (SYN<>ACK<>SYN/ACK). If you’re fetching the root object of a webpage — the primary URL of www.yoursite.com — you establish a single connection and that is your connect time. If you’re testing a full web page, most browsers establish six concurrent connections. So make sure you understand what the metric being reported by the testing vendor actually means and is referencing. This metric is bound by round-trip latency (the dominant input) plus any penalty an overloaded piece of hardware would add. You can always improve this with increased infrastructure distribution, both geographically (turning up new locations, for instance, would be the primary way to improve this component) and physically (adding more servers/load-balancers if they are at capacity on TCP connections).
TLS Handshake. Many websites are moving to full-site Transport Layer Security (TLS), and Google has started giving sites using secure HTTPS connections a ranking boost. Be aware of how long it takes to establish your TLS handshake — TLS handshakes can incur several roundtrips, significantly compounding page load times, so it’s important to terminate TLS as close to the user as possible (i.e., by using a CDN). Make sure your own (or your vendor’s) TLS stack is optimized. If you use a third-party vendor (CDN, ELB) to terminate TLS, stay on top of them to ensure both performance and security.
WAIT or First Byte. Once the connection is set up, WAIT is the time it takes to receive the first byte of the response for the primary URL. An easy way to think about this is that it’s connection time plus any disk penalty for getting the first byte of data back to the client. If computation delay (e.g., time to fetch the image off disk or RAM) was zero, then this would equal connection time. Physics states that WAIT time can never be less than connect time, and a well-designed and properly scaled architecture will have a median delta of less than two milliseconds. One caveat here for CDN users: for pass through (where you tell intermediate caches not to store content and the CDN has to fetch the content from origin), WAIT will be significantly different from connect.
Content Download or LOAD. This is the time it takes between loading the first byte to the last byte of the URL you are testing. This is essentially a function of bandwidth, latency, and how well the TCP flow control algorithms work between the client and server. Plenty of tweaks at the OS level can help this, but you gain the most by simply sending less data, so compress as much as possible. Every modern browser will accept gzip compression and you can set it up either on your end at the web server or load-balancer, or inside your CDN if you’re using one.
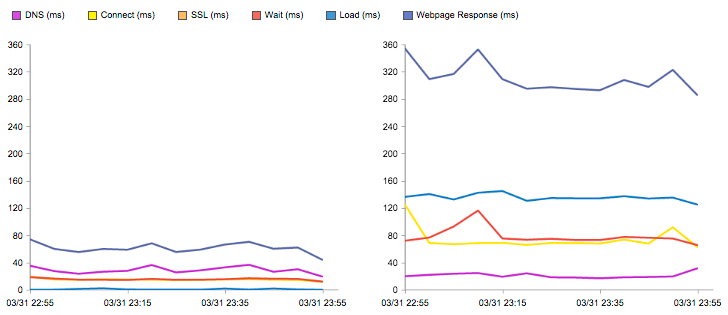
Below is an example of a Catchpoint Performance Chart (remember that the terminology we’re using tends to be Catchpoint specific — there are many tools out there that may call these components something different) that shows how the same object performed through a CDN and directly from origin. You can see the five components we just discussed and the sum of all the individual components is delineated by “Webpage Response (ms).”
Next steps
A great place to start is to run a test on your site and see your optimization score on Web Page Test. Do your research on the different TPM vendors (we prefer Catchpoint, but there are others), understand exactly how your vendor is testing performance, and don’t be afraid to invest time and money in the process — this is not the time to go bargain hunting.
As I’ve illustrated, monitoring performance is vital to understanding your end user — use the data you discover to focus on core metrics and drive improvement.