
In 2019, holiday shoppers could order gifts online from the comfort of their home or office, or head to the malls and stores to take advantage of limited-time “doorbuster” sales as they had been doing for years. In 2020, online shopping heading into the holiday weekend was boosted given the general hesitancy to shop in-store due to the ongoing pandemic. Throughout 2021, COVID-19 ebbed and flowed, with some areas reopening and trying to return to “normal” as case numbers dropped and vaccination counts grew, only to reintroduce mandates or go back into lockdown as infections once again surged. These shifts, along with widely reported staffing and supply chain issues, often made shopping at physical retailers a hit-or-miss proposition.
Heading into this year’s Cyber Five weekend, we analyzed longer-term normalized traffic trends observed across 100 of our top* United States-based ecommerce/retail customers, wondering if they would be similar to those observed in 2020, or more like the “before times” of 2019. We also analyzed real-time traffic trends during the holiday weekend. Media reports (Raleigh, Denver, Boston) indicated that in-person shopping on Black Friday appeared to be back in 2021, though the doorbuster sales really weren’t — did this impact online shopping?
In addition, we looked at web attack activity targeting ecommerce/retail sites during the holiday weekend to understand which vectors were the most popular. And to better understand behavior after the holiday meal was complete, we explored the traffic patterns observed across our top* United States-based digital media customers.
Key findings include:
Black Friday once again steals the digital spotlight: The highest-traffic shopping day of the Cyber Five was Black Friday, with peak request traffic clocking in at upwards of 40% higher than Thanksgiving and 5% higher than Cyber Monday.
Early sales drove traffic: Tracking aggregate daily traffic across the four weeks ahead of Cyber Monday, traffic grew as much as 27% ahead of the holiday weekend as compared to the November 1 baseline.
I screen, you screen: Media consumption on Thanksgiving started early in the day, though peak media traffic was seen on Sunday.
Web attacks on the weekend: XSS (Cross-site scripting) and SQLi (SQL injection) were the two most popular web attack vectors targeting commerce sites, but peak attack signal volume was seen on Saturday.
Long-term perspective

With some shoppers returning to brick and mortar stores but COVID still everpresent, it wasn’t clear which direction consumer behavior would head in 2021. In comparing normalized ecommerce customer traffic during the 28-day period before Cyber Monday across 2019, 2020, and 2021, we see that traffic this year was comparatively strong, remaining above the baseline across the entire month. In contrast, in 2019, it remained mostly below the baseline until Black Friday, while last year, growth picked up after a slow first week.
In 2021, traffic increased steadily across the four weeks, growing as much as 27% ahead of the holiday weekend. Black Friday peaked at 42% above the baseline, while Cyber Monday was 38% higher. In comparison, 2020 saw Black Friday and Cyber Monday peaks of 33% and 31% respectively, while those days peaked at 21% and 17% above the baseline in 2019. Even though retailers reportedly spread out sales promotions across weeks and months ahead of the holiday weekend, it appears that online Black Friday sales remain alluring to U.S. consumers.
By day
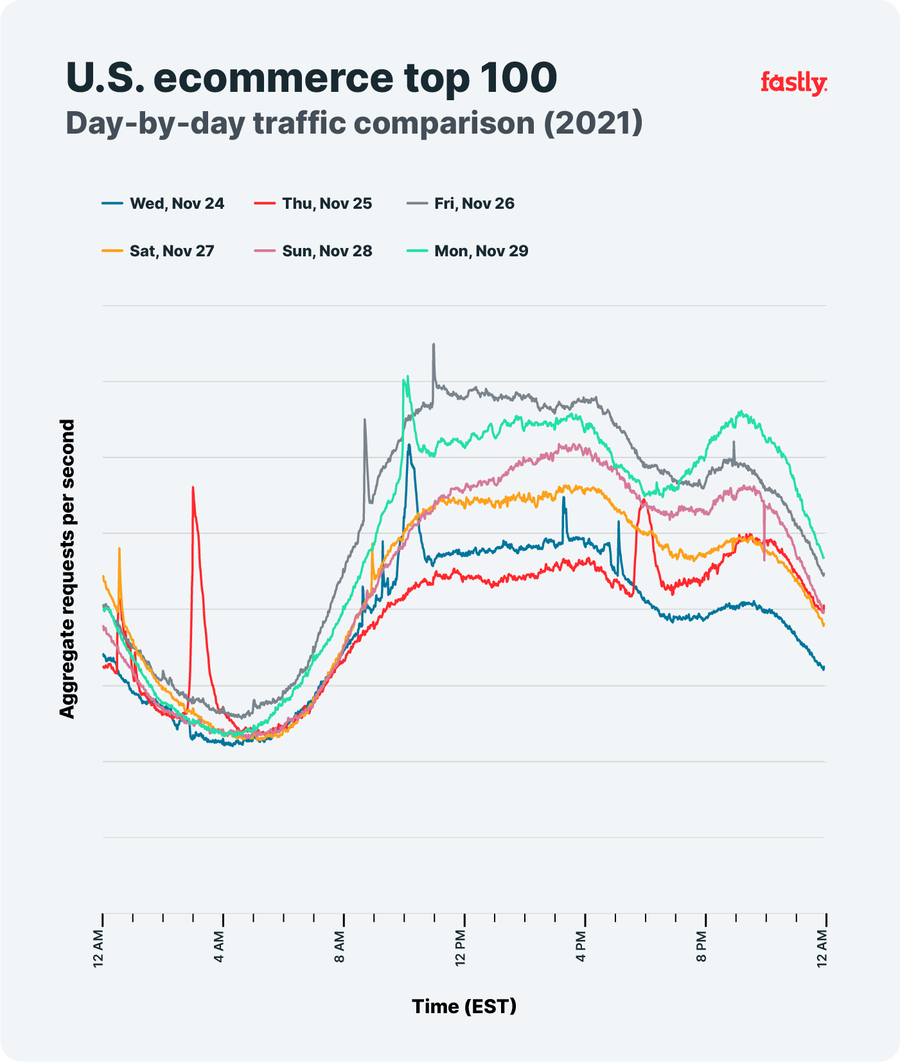
While the macro view above shows aggregated behavior at a daily level, what did traffic to this cohort of ecommerce sites look like during the days of the long holiday weekend? This figure compares real-time traffic (requests per second) volume by day for the period spanning Wednesday, November 24 (the day before Thanksgiving) through Monday, November 29 (Cyber Monday). Note that the visible spikes are from traffic surges to/potential attacks against individual customers and were not considered when identifying and analyzing peak traffic volumes. The visibility of these spikes does, however, serve to highlight the threat that “bad bots” present, underscoring the importance of bot management and detection services.
At a high level, the daily traffic patterns were fairly similar to those observed in 2020. Perhaps unsurprisingly, traffic during the day on Thanksgiving was the lowest of all of the surveyed days, at least until the early evening, when it jumped ahead of Wednesday’s evening traffic volumes — a pattern observed last year as well. This could be attributed to retailers running pre-Black Friday sales or shoppers looking for early deals. A similar daily pattern was also seen with Black Friday and Cyber Monday, with Black Friday generating higher traffic for most of the day, but Cyber Monday jumping ahead in the evening, possibly due to shoppers looking to take advantage of sales before the holiday weekend ends. It is also interesting to note that traffic patterns were relatively similar during the early morning hours, but acceleration on Black Friday and Cyber Monday began as the sun rose on the U.S. East Coast, while it ramped several hours later on the other days.
In comparing peak traffic levels for the two highest traffic days, we found that Black Friday peaked around 5% higher than Cyber Monday. As compared to the two previous days, peak traffic on Black Friday bested Wednesday’s and Thursday’s peaks by 40%. As for the weekend days, Black Friday’s peak was 23% higher than Saturday’s, and 13% higher than that seen on Sunday.
Week to week
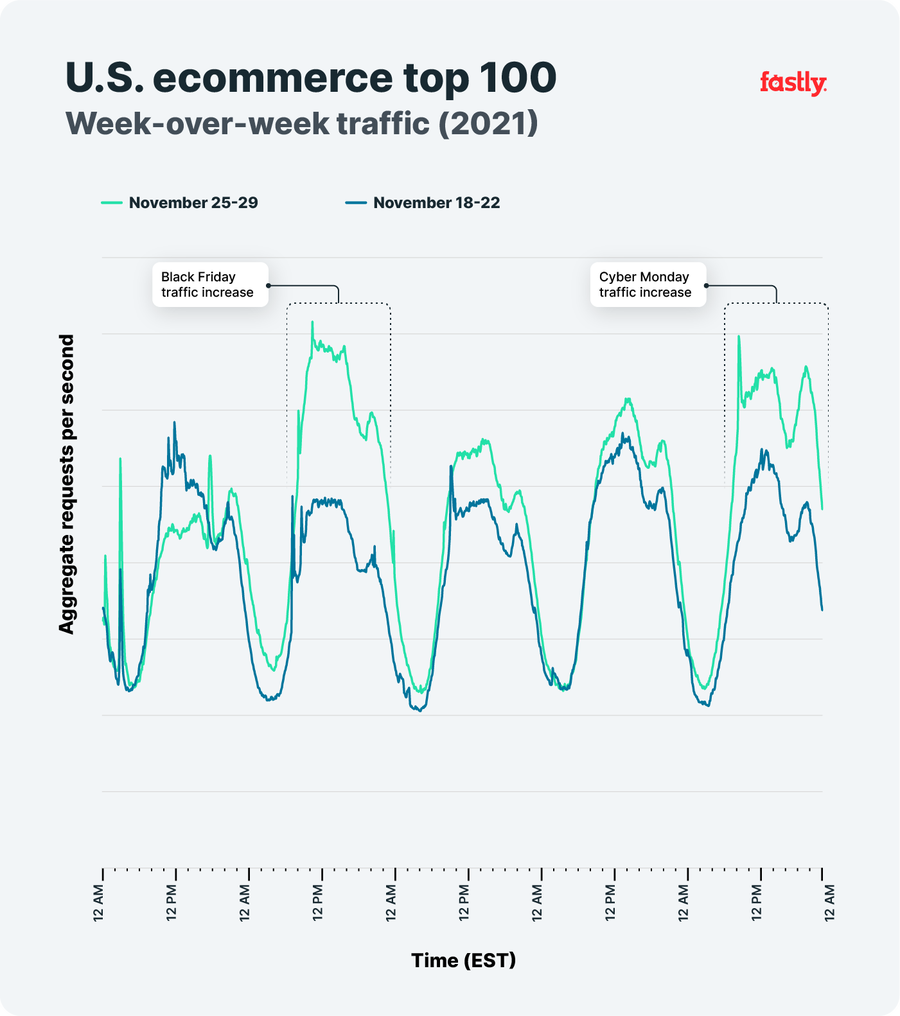
In comparing traffic patterns during the Cyber Five weekend to those seen during the same days one week prior, several things stand out. As noted in the previous section, Thanksgiving got off to a slow start, with traffic levels remaining below those seen the previous Thursday until around 9 p.m. EST, when the higher traffic levels seen across the holiday weekend really began. On Black Friday, peak traffic was just over 40% higher than November 19’s peak, while Cyber Monday peaked around 20% higher than on November 22. These differences were greater than those observed in 2020, which were 26% and 17% respectively. Differences were more muted over the weekend, with Saturday approximately 15% higher than November 20, and Sunday just under 10% higher than November 21.
Regional notes

We also analyzed long-term traffic trends heading into the holiday weekend for cohorts of top ecommerce customers across the North America (U.S., Canada, and Mexico), EMEA, and Asia Pacific regions.
North America: As expected, the trend here maps very closely to that seen above for the United States. Peak traffic here on Black Friday reached 60% above the baseline, and over 40% above on Cyber Monday, thanks in large part to the contribution of large Canadian ecommerce customers.
EMEA: In this region, normalized traffic danced around the baseline over the course of the four-week period. On Black Friday, it was 16% higher than the baseline, and higher on Sunday (14% above baseline) than on Cyber Monday (7% above baseline). This may be due to several factors. In looking at the graph, it appears that weekly peaks occur on Sundays, so the holiday weekend pattern is in line with that. In addition, because Thanksgiving on the last Thursday of November and the associated shopping weekend remain largely a U.S. custom, this pattern may not be unexpected.
Asia Pacific: Although traffic in the Asia Pacific region generally remained above the baseline in the weeks heading into the holiday weekend, traffic drops are evident on both Black Friday and Cyber Monday. This may be because similar to EMEA, the holiday shopping weekend is not an institutionalized custom within the region. In addition, because the traffic data underlying this graph are aggregated daily based on UTC day boundaries, time zone differences may also come into play.
Web attacks
Ecommerce web sites are a popular attack target, whether for attackers attempting to find or exploit vulnerabilities, bots trying to purchase large quantities of limited-edition products, or malcontents trying to DoS a site into submission with a flood of traffic. Using “signal” data from our next-generation WAF, we analyzed signal patterns across the holiday weekend for five of the most common types of web attacks. These include XSS (cross-site scripting), SQLi (SQL injection), TRAVERSAL (path traversal), CMDEXE (command execution), and BACKDOOR.
These signals were generated through the analysis of requests to more than 100 Commerce WAF customers. Note that there may be some overlap between this list and the Top 100 list of commerce customers discussed above. Because of the erratic nature of the signals as shown in the graphs below, we chose to compare median signal volumes, rather than peak levels, as was done in the traffic analysis above.

On Black Friday, XSS and SQLi were the two most active web attack signals, with the median signal volume for XSS about 10% higher than that for SQLi. Looking back at prior Fridays in November, the median XSS signal volume grows week over week, while no clear trend is found for SQLi.

On Cyber Monday, XSS and SQLi were again the two most active web attack signals, with the median signal volume for SQLi about 150% higher than that for XSS. Looking back at the four prior Mondays in November, these two signals exhibit opposite trends, with median XSS signal volume its highest on November 15, while median SQLi signal volume was at its lowest on that day.

The web attack signal trend graph for the full Cyber Five holiday weekend is fairly cluttered, in contrast to the individual daily graphs. While TRAVERSAL, CMDEXE, and BACKDOOR all experienced individual spikes, XSS and SQLi were the most prevalent attack signals during this extended period as well. In this case, the median SQLi signal volume was just over 20% higher than that calculated for XSS. Comparing SQLi to the other three signals, its median volume was 115% higher than the median for TRAVERSAL, nearly 220% higher than CMDEXE’s median, and nearly 6000% greater than the median signal volume for BACKDOOR. Unexpectedly, the biggest spikes in absolute signal volume came not on Black Friday or Cyber Monday, but on Saturday, November 27.

In order to better understand the distribution of these five web attack types across the holiday weekend, we aggregated the signals on a daily basis in order to compare the relative percentages. This allows us to illustrate just how dominant SQLi and XSS are — the former accounted for between 26% (Thanksgiving) and 46% (Sunday) of web attack signals, while the latter made up between 24% (Sunday and Cyber Monday) and 39% (Thanksgiving). TRAVERSAL attacks comprised between 16% (Black Friday) and 21% (Thanksgiving) of signals, while CMDEXE attack signals ranged between 8% (Saturday) and 14% (Cyber Monday) of the total. BACKDOOR signal volume lagged well behind, reaching 5% (Saturday), but otherwise at or below 1% of the aggregate.
Digital media
In addition to examining traffic trends across ecommerce customers, we were also interested in media consumption trends, especially on Thanksgiving — what observations can we make about post-feast behavior based on an analysis of aggregate real-time (Tbps) traffic for a cohort of 100 of our top* U.S.-based digital media customers? Standing alone, the traffic graph for Thanksgiving doesn’t tell us much. However, insights begin to emerge when compared to other days, as we do below.
Week to week

In comparing media traffic on Thanksgiving Day to that of the previous Thursday (November 18), a shift in behavior becomes apparent. On the 18th, media consumption ramps gradually through the day, peaking in the evening — with children at school during the day, and adults working, this pattern is presumably “normal.” However, on Thanksgiving Day media consumption ramps up earlier in the morning, as people on the east coast are waking up. Traffic stays elevated (in comparison) throughout the day, presumably because watching streaming content is a way of keeping the non-cooks occupied and out of the kitchen, as well as a way to pass the travel time heading to the holiday celebration.
On Thanksgiving Day, a perturbation in the graph is clearly visible between 4:30 and 8:30 p.m. EST. Further research shows that this aligns with the Cowboys vs. Raiders football game, with a sharp drop-off in viewers after the Cowboys lost in overtime. Less obvious, but still somewhat visible, is the perturbation between 9 a.m. and noon EST, likely associated with the Macy’s Thanksgiving Day Parade.
Year to year

Comparing media consumption on Thanksgiving Day 2021 to that of 2020, we see similar trends. (In this case, the real-time traffic volumes were normalized to midnight to account for differences in the cohort members, as well as differences in absolute traffic volumes.) As observed this year, traffic on Thanksgiving 2020 also ramped during the morning hours. In addition, football was a big streaming draw last year as well, with the bump in traffic between 12:30 and 4 p.m. EST due to the Lions vs. Texans game.
By day

As we did above for ecommerce traffic, we also compared real-time media traffic across the days of the holiday weekend to see how the observed trends compared on a daily basis. The figure above shows that the highest peak traffic level was seen on Sunday, with generally higher traffic levels throughout the day as well. This could have been driven by a need to take the day to relax, post-holiday festivities, and before returning to work and/or school, as well as additional media consumption during homeward-bound travels. The second highest levels of media consumption were seen on Saturday, even above those on Thanksgiving. A football game-like traffic pattern is visible on Saturday between approximately 4 and 7:45 p.m. EST, possibly related to one or more college football games.
The lowest levels of traffic were observed on Wednesday (the day before Thanksgiving) and Cyber Monday, presumably due to the demands of school and work. However, an interesting traffic increase is visible between approximately 2:45 and 5 p.m. EST on Wednesday - this may have been related to the Atletico Madrid vs AC Milan UEFA match.
Conclusion
One retail tracking firm observed that in-store Black Friday traffic in 2021 was up over 47% as compared to last year, while Adobe observed that online spending was down for both Black Friday and Cyber Monday as compared to last year. This reduced spend may indicate the effectiveness of sales and promotions run by online retailers in the weeks leading up to the holiday weekend (as we saw in the growth of traffic through November), as well as a manifestation of consumer concern about supply chain and delivery issues, preferring the immediate gratification purchasing gifts in person. But regardless of when and where we are doing our shopping, watching football after the Thanksgiving meal apparently remains a sacred tradition.
*By total traffic (GB) delivered through Fastly