
One of our goals is to provide you with more control over the administration and analysis of your video services. We are pleased to announce that we now send additional metrics from our On-the-fly Packaging (OTFP) service to provide more granular visibility into the packaging and delivery process. You can stream Video Delivery Insights as logs from your Fastly service to the endpoint of your choice, giving you the flexibility to analyze and modify your settings on the fly. You’ll now be able to understand which formats and resolutions are being requested and delivered and how engaging your media is.
Before we dive into what’s new, let’s examine the different types of video metrics that were already available.
Last-mile visibility
There are two ways you can get visibility into video delivery — server-side analytics and client-side analytics.
Server-side video analytics provide visibility into metrics associated with the packaging and delivery of your video content. This approach views video delivery through an infrastructure lens — measuring what’s packaged and delivered to an end user. These metrics are usually exposed in log files generated in the video servers.
Client-side analytics provide visibility into metrics associated with the playback and actual consumption of the video content. This approach views video delivery through a video player lens — measuring what a user actually watched. These metrics are typically generated through integration with that provider’s libraries or software development kit (SDK).
By analyzing these complementary data sets together you can uncover and validate trends and anomalies so you can better manage your end-to-end video service.
What’s new
Fastly values giving our customers control and visibility into their video delivery processes. For example, we can show how many requests for a file occurred, how many bytes were delivered, the number of errors, hits, misses, etc.
With today’s announcement, we’re enhancing our server-side video metrics by adding additional log fields you can use in your analysis:
ss - video segment start presentation time in seconds
sl - video segment duration in seconds
vl - video duration in seconds
rs - video track display resolution in pixels
This enhancement allows you to run additional queries and segment your analysis so you can drill down to uncover more granular insights. You’ll now be able to answer questions like:
How many requests for a file were at 1080p resolution in the last 24 hours?
How many concurrent requests over the last 30 minutes were in DASH format?
How many users finished the third quartile of the video?
Asking and answering questions about your service in real time helps improve your team’s agility and effectiveness. You can pinpoint abnormalities or trends, then instantly deploy or roll back configurations, refining your video delivery settings over time.
Getting set up
Let’s look at how you can start collecting, processing, and analyzing your OTFP metrics. We’ll walk through a real-world example of how to set up Fastly and other third-party logging and data visualization services so you can get the most out of your new metrics. Total setup time will take about 10 minutes.
Step 1: Update Fastly VCL
Using Custom VCL, update your Fastly service VCL with the sample snippet below:
sub vcl_deliver {
  # Identify Request type
  if (req.url.ext ~ "m3u8|ts|aac|webvtt") {
    set resp.http.Otfp-Format = "HLS";
  } else if (req.url.ext ~ "mpd|m4s") {
    set resp.http.Otfp-Format = "DASH";
  } else {
    set resp.http.Otfp-Format = "OTHER";
  }

# Extract name-value pairs Otfp Info herder
  if (resp.http.X-Fastly-Otfp-Info) {
    set resp.http.Otfp-SS = regsub(resp.http.X-Fastly-Otfp-Info, ".*ss=(\S+).*", "\1");
    set resp.http.Otfp-SL = regsub(resp.http.X-Fastly-Otfp-Info, ".*sl=(\S+).*", "\1");
    set resp.http.Otfp-VL = regsub(resp.http.X-Fastly-Otfp-Info, ".*vl=(\S+).*", "\1");

# Resolution (rs name-value) not available for audio-only segments
    if (resp.http.X-Fastly-Otfp-Info ~ ".*rs=(\S+).*") {
      set resp.http.Otfp-RS = re.group.1;
    } else {
      set resp.http.Otfp-RS = "-";
    }
  }
#FASTLY deliver

  return (deliver);
}
Step 2: Create logging endpoint
Instructions for creating logging endpoints can be found here. In this example, we’re using Google Cloud Storage (GCS) as the logging endpoint, but we support a variety of common logging endpoints. Simply create a new GCS endpoint in Fastly, fill in the required information in the wizard, and you’re all set! You can then push this data in GCS to any data store like Google’s BigQuery.
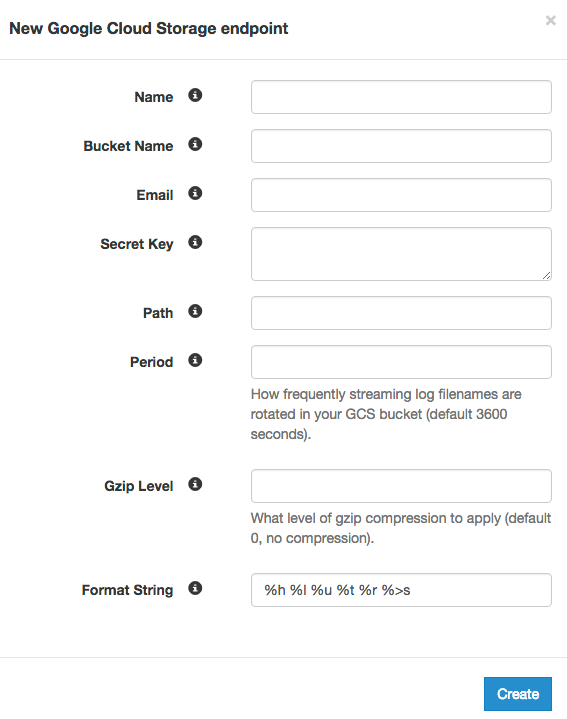
In the wizard, you’ll need to set the format string field to the following:
%h now.sec %r %>s %b resp.http.Otfp-Format resp.http.Otfp-SS
resp.http.Otfp-SL resp.http.Otfp-VL resp.http.Otfp-RS
You can also attach a condition to logging endpoint to send logs only when the following conditions are met:
Video segment requests
Exclude sending logs from Fastly’s Origin Shield
You can do this by setting the “Apply if” condition to:
resp.http.X-Fastly-Otfp-Info && !req.http.Fastly-FFStep 3: Visualize your data
We used a basic version of Tableau to aggregate and visualize the logs in our example below, but there are many third-party or open source visualization software options.
Viewer engagement use cases
Now that we have our environment set up, let’s examine a few sample charts that you can generate with Fastly’s Video Delivery Insights.
The graph below illustrates how engaged users are with your video content by reflecting how viewing changes throughout the duration of the video.
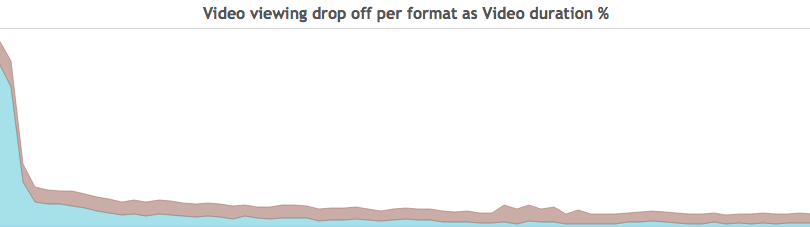
This chart helps you understand user engagement over time. It breaks down views into how often the video was delivered beyond certain thresholds including first quartile (number of times the video played to 25% of its length), midpoint (50% of its length), third quartile (75% of its length), etc.
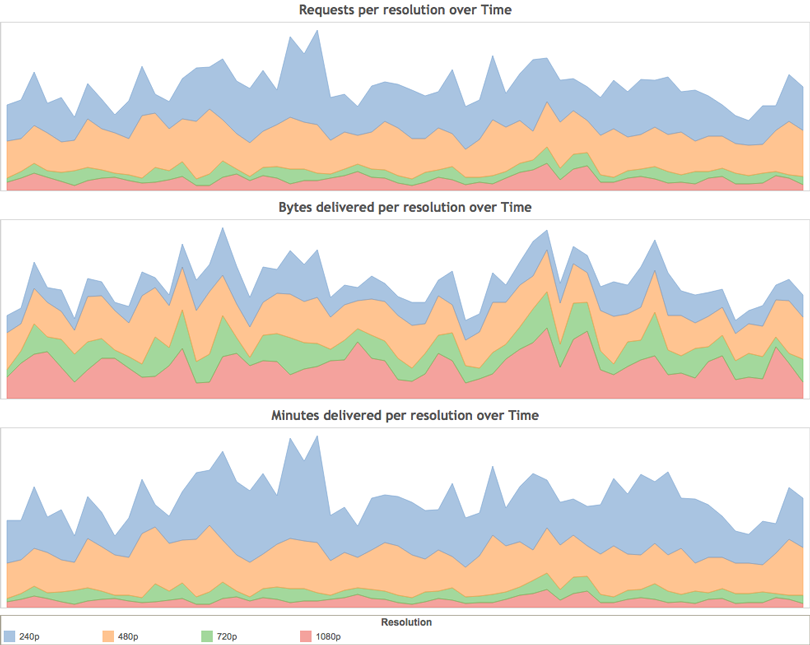
These graphs break down video traffic based on what resolution users are consuming. They provide valuable information about the quality of experience by showing what was requested versus actually delivered for each resolution.
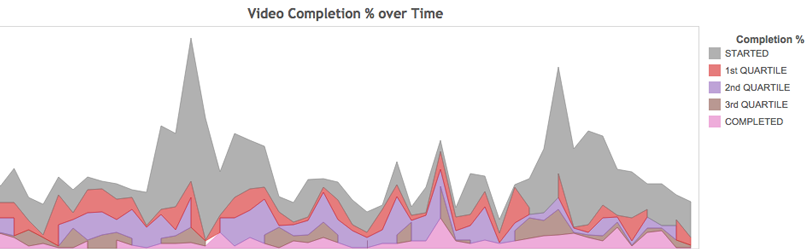
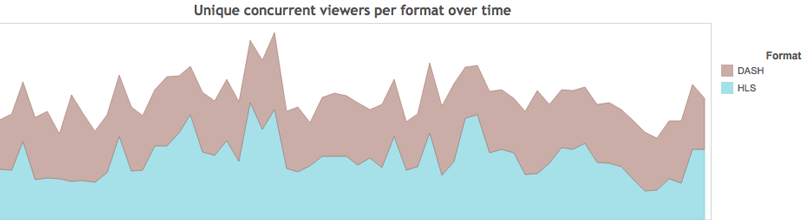
This graph helps you visualize how many concurrent users are viewing different formats across your video library, showing the most popular time of day for each video format.
We hope the new Video Delivery Insights will help you optimize your viewer engagement and maximize the impact of your media. If you’d like to try this out for yourself, sign up for a free trial of Fastly or contact sales.