
The breadth of our network and volume of our traffic provides a portal of sorts into the global zeitgeist, helping us observe the moments the world goes online to share in a collective experience. But unlike the Super Bowl or Black Friday, we can hardly call the 2020 U.S. presidential election a “moment”. Indeed, our view of the 2020 Election starts months before Election Day and continues days after.
Though many of us are feeling a bit of fatigue from the enduring coverage, we thought it’d be interesting to look at it from a different point of view: how network traffic during the 2020 Election season cast a spotlight on our collective shift in behaviors — when people tuned in, “gleefreshed”, or “doomscrolled” for up-to-the-second updates. We’ll look at network traffic for Fastly’s digital publishing customers during the presidential debates held in September and October, the time between Election Day and when a winner was projected, and the moment the major networks named a winner.
Chapter 1: Presidential debates
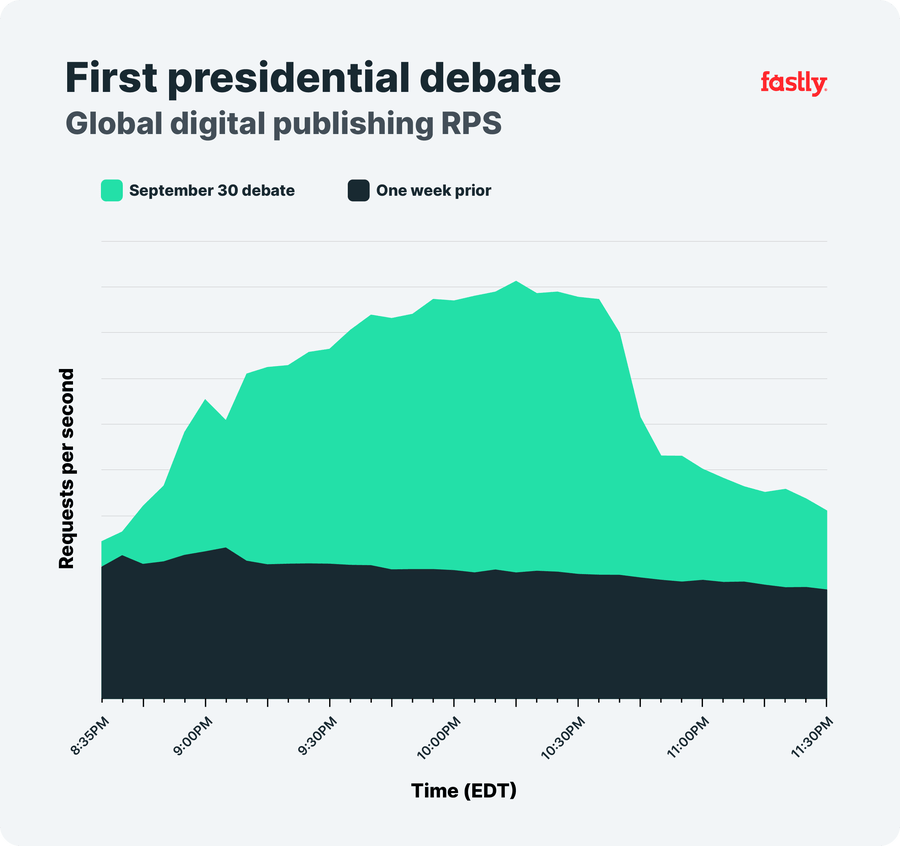
Our story starts in September, when our news and media customers and our own Mission Control team were handily preparing for the first presidential debate. During the debate on September 29, our global digital publishing customers saw a 176% increase in requests per second (RPS)* compared to the previous week.

While we can’t say for certain, we can speculate that some luster may have worn off by the second presidential debate on October 22. While there was still a notable uptick — we observed a 49% increase in RPS across our global digital publishing customers, compared to the previous week — the jump was significantly lower than what we saw during the first debate.
And while curious viewers may have tuned in to see how newly updated debate rules would be enforced, we didn’t see the same peak traffic levels we observed during the first debate. We saw an 18% lower traffic peak across our network during the second debate compared to the first debate on September 29.
Chapter 2: Election Day becomes election week

In 2016, election results were determined within 24 hours of the last polls closing — a U.S. tradition with very few exceptions. This year, however, Election Day became election week, running from November 3-7. And while we’ve all seemingly been glued to our phones and laptops since COVID-19 forced the world online in early spring, this election still saw notably higher traffic.
Unsurprisingly, there were additional spikes when battleground states were announced. During the time between the polls closing and the major networks naming a projected winner, our global digital publishing customers experienced a 406% increase in RPS compared to the previous week, with spikes occurring when:
Polling locations began closing
AP_Politics calls Wisconsin (2:16pm EST, November 4)
AP_Politics calls Michigan (6:00pm EST, November 4)
DecisionDeskHQ calls Pennsylvania (8:50am EST, November 6)
Chapter 3: Networks and news outlets name Joe Biden electoral count victor

One of the highest traffic moments during the 2020 election, according to the Fastly network, was directly following the announcement of Joe Biden being named the electoral count victor. Our global digital publishing customers saw a near-immediate 440% increase in RPS, compared to the week before.
Most meme-worthy moment

After days of waiting, people across the world searched for ways to express their reaction. Many found help from GIFs. Our GIF and meme-generating customers experienced a 27% increase in RPS compared to the previous week, suggesting that was one of the most meme-worthy moments of the 2020 election.
Divisions aside, we can agree on this: we share our biggest moments online
Through these findings, we continue to observe that people around the world rely on the internet — during all hours of the day — to get access to critical information. The internet has taken a central role in our ability to consume and share various experiences, with the election as a clear example of this dependency.
*RPS represents the number of content requests per second to Fastly's network.