

TL;DR
To understand how the internet is performing with the changes in internet use brought on by the COVID-19 pandemic, we investigated two key metrics during February and March in some of the countries and states that were hit hardest by the virus: changes in the traffic volume served to those regions as a reflection of changes in internet use, and changes in download speed measured at our servers as a reflection of internet quality. In almost all regions, the largest increases in traffic volume occurred immediately after public policy announcements, such as school closures or stay-at-home orders. Similarly, the most dramatic decreases in download speed followed the official starts of those policies — presumably when populations made the shift to staying home.
Overall, the internet is in good health, thanks to the regionality of these degradations and the elastic nature of modern websites and internet applications. While websites may take a bit longer to load, and streaming video quality of experience (QoE) may be reduced for some, they will all continue to work.
Industry-wise, news, streaming, and social media stood out as significant increases of new traffic as the world turns to the internet for information and entertainment more than ever before.
As we all do our part to keep each other safe by staying, learning, and working from home in the midst of COVID-19, we’re pushing the internet to work harder than it’s ever worked before. This new normal has caused many to wonder: with so many people at home and online, can the internet handle this increased load?
Fortunately, the answer is yes — it can and it is. As you’ll see in the geo-specific data below, while the quality differs from region to region and is largely affected by policy shifts at the local level (like school closures and stay-at-home orders), the internet’s built-in elasticity allows it to adapt to our needs. We’re also learning, connecting, and streaming much more than we did just a month ago, as you’ll see within our industry vertical findings.
To understand how the COVID-19 pandemic is affecting the internet at large, we looked at traffic from February and March in some of the hardest-hit parts of the globe and across popular verticals and content types. In our analysis, we uncovered what types of events caused traffic spikes, how internet performance was affected by those spikes, and whether or not the web can continue to handle this new level of traffic in the days and weeks ahead.
Internet performance around the world
In each geo-specific graph shown below, we investigated the volume of traffic going from our servers to the region and the download speed of traffic to the region as measured at our servers. To see how public policies and the severity of the pandemic affects each region’s traffic and performance, the number of reported cases of COVID-19, and the dates on which public policies were enacted, are also plotted on each graph.
Before diving into the numbers, let’s take a moment to clarify why increased traffic might result in slower speeds. There are a variety of points in the connection that affect download speeds. For instance: your individual home WiFi network, your internet service provider's capacity, the networks between your internet service provider and us, and our network. The quality degradation that we report here was observed outside of our networks and interconnects. And, although we can't point to a specific place where the degradation occurred, the information below reflects what end users experienced.
Italy
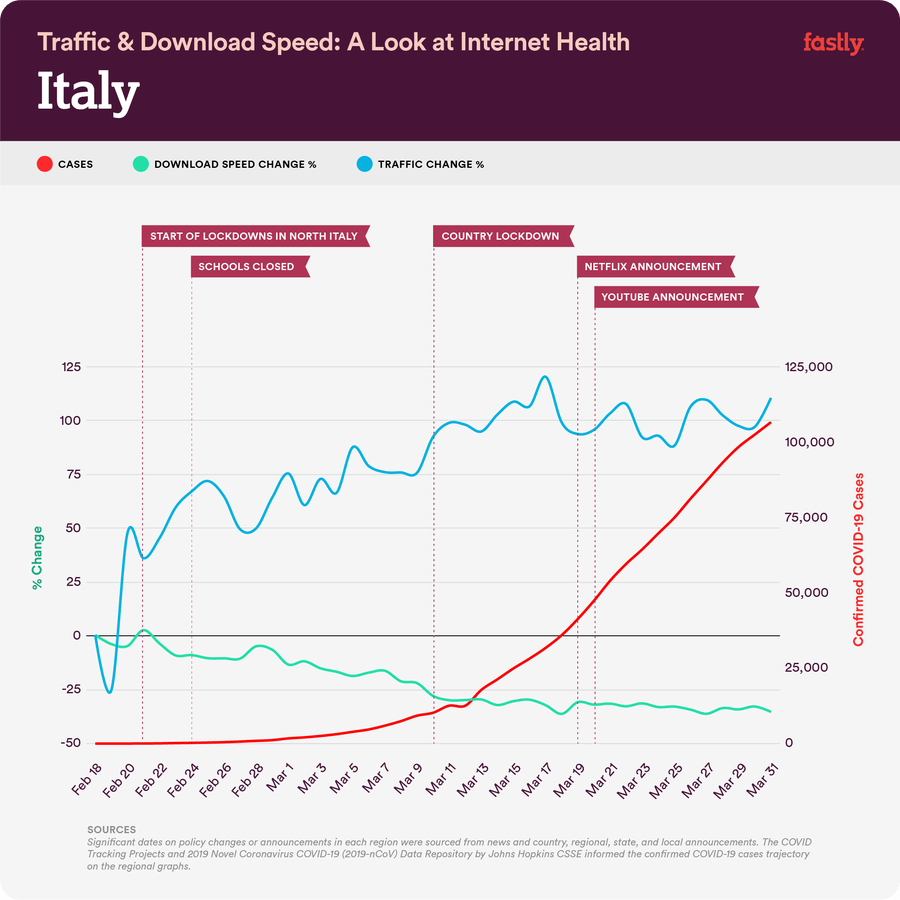
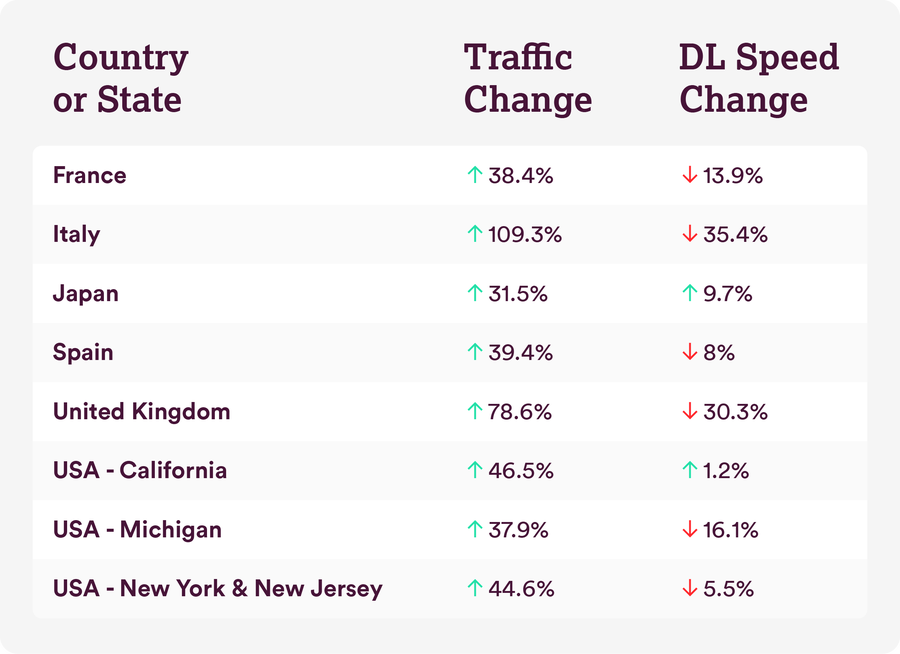
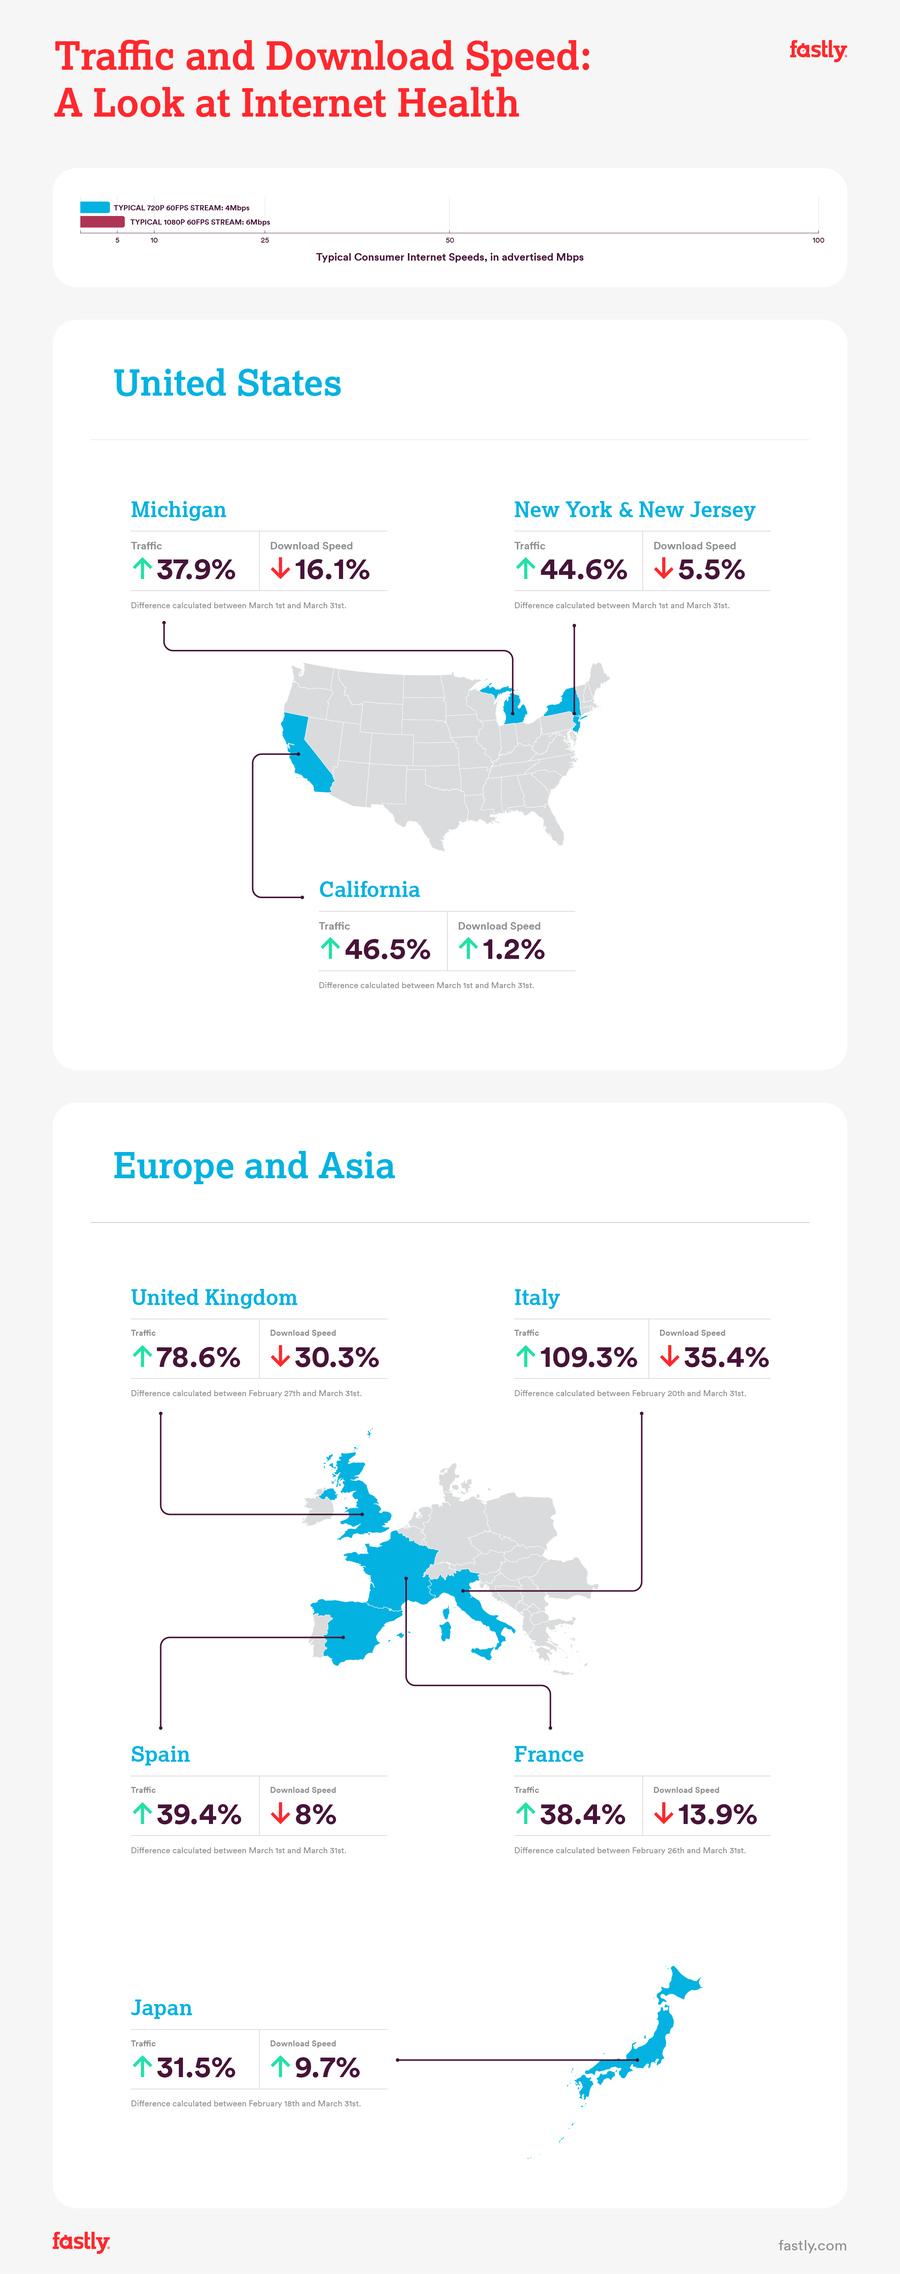
Using traffic and average download speed on February 18 as a baseline, traffic in Italy increased by 109.3% over the roughly one-month period from February 20 to March 31, and download speed decreased by 35.4%.
There are two noticeable upward traffic shifts in Italy with similarly noticeable downward shifts in speed. The first occurred between February 18 and February 20, when traffic increased by a whopping 47%, likely due to public information and activity regarding the stay-at-home orders of various parts of Northern Italy. Combined with the announcement of country-wide school closures on February 22, and those school closures going into effect on February 24, download speeds fell by about 9.2%, as traffic in this part of the country likely shifted predominantly to using the internet from home.
The second noticeable shift occurred when the full country issued a stay-at-home order on March 10 — at which point nearly all internet use shifted to homes. As a result, traffic increased by 23% and download speeds decreased by 7.8% between March 9 and March 11. Traffic and download speeds remained relatively stable after March 15.
Japan
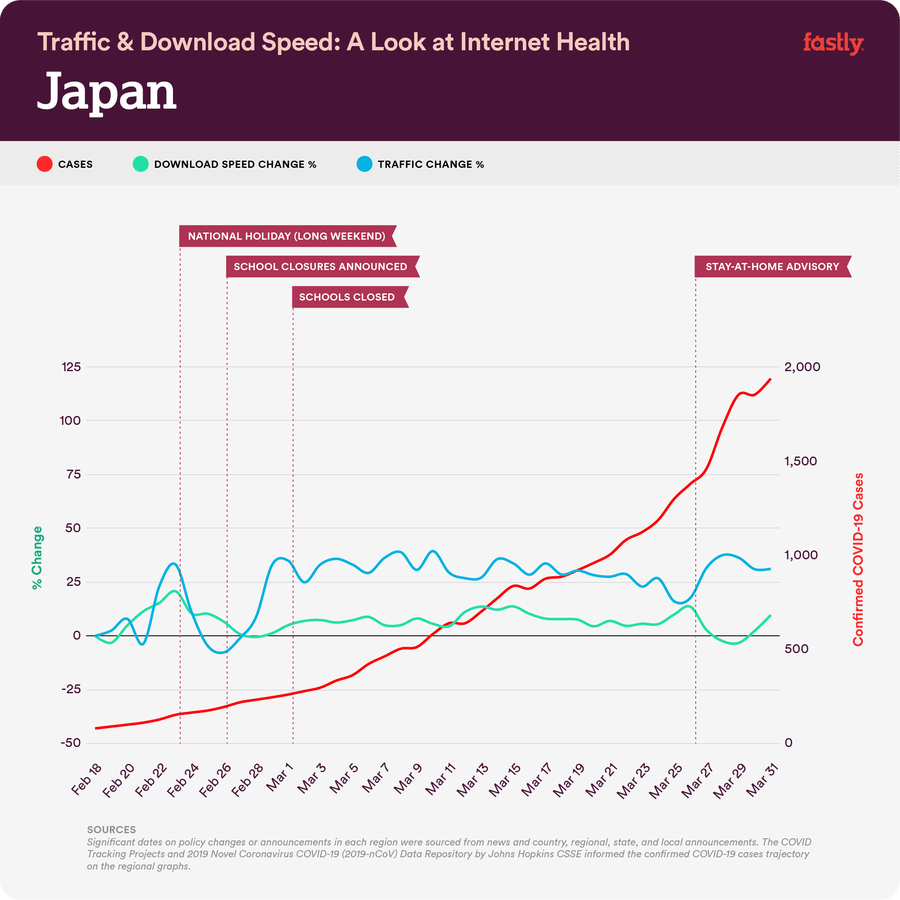
Using traffic and average download speed on February 18 as a baseline, traffic in Japan increased by 31.5% from February 18 to March 31, and download speed increased by 9.7%. It is likely that Japan’s internet infrastructure was able to absorb this increased load.
Following the announcement of school closures on February 27, traffic jumped by 38% and download speeds decreased by 9.2%.
Traffic escalated again — by 20.1% — on March 27, when stronger social distancing measures were encouraged due to a sudden increase in cases in Tokyo.
United Kingdom
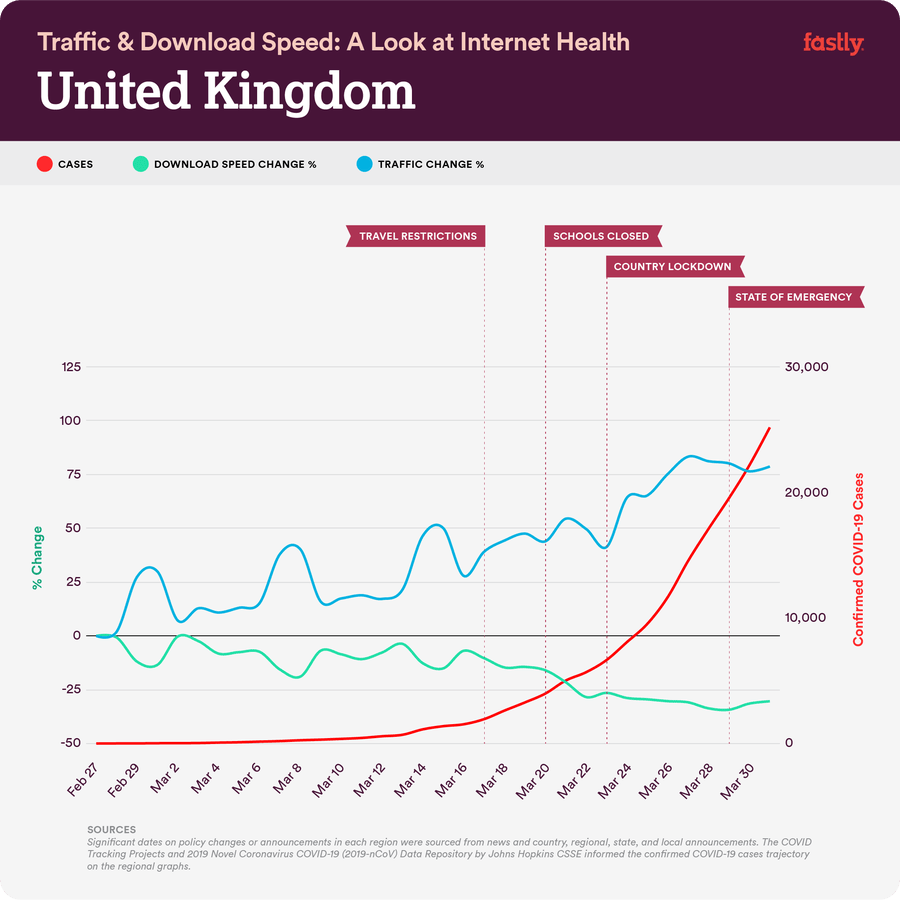
Using traffic and average download speed on February 27 as a baseline, traffic in the UK increased by 78.6% over the nearly one-month period from February 27 to March 31, and download speed decreased by 30.3%.
A 16.3% increase in traffic and a corresponding 7.7% decrease in speed directly followed the government’s announcements regarding travel and social gathering restrictions on March 17. The country-wide stay-at-home order on March 23 seemed to trigger a 14.5% increase in traffic, but only a 0.4% decrease in download speed, possibly indicating that the population had already become largely homebound by then.
France
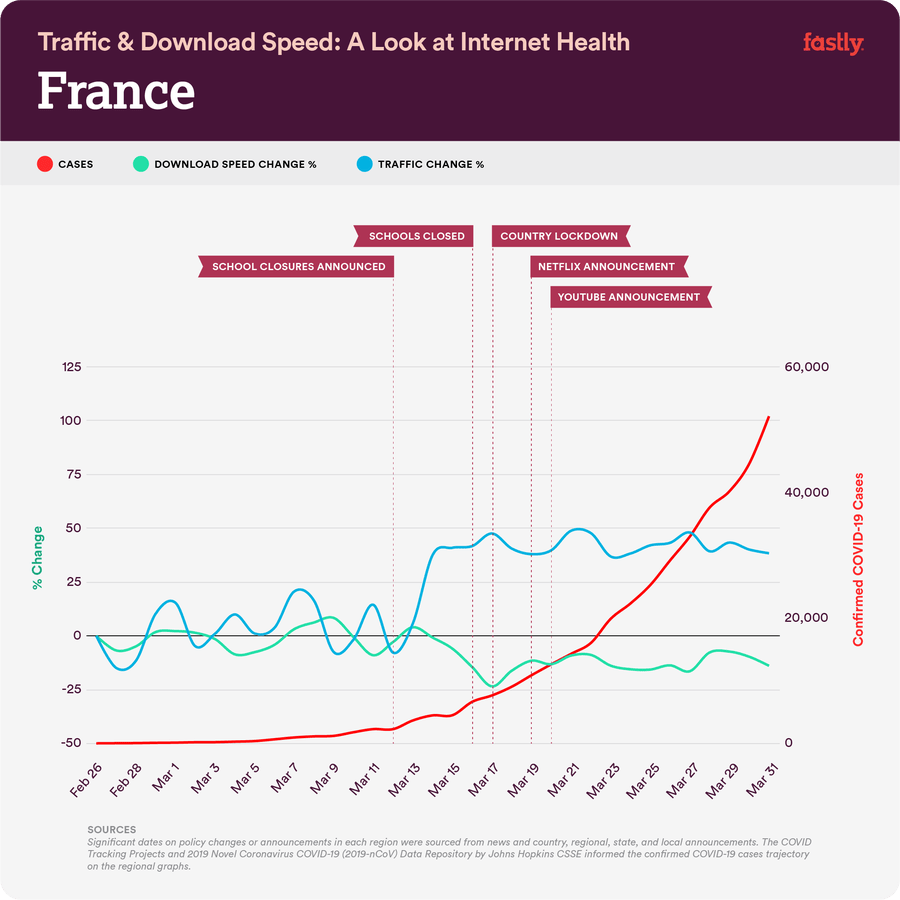
Using traffic and average download speed on February 26 as a baseline, traffic in France increased by 38.4% from February 26 to March 31, and download speed decreased by 13.9%.
France’s steepest increase in traffic — a 45.4% jump — occurred shortly after school closures were announced on the evening of March 12. Download speed subsequently decreased, but at a slightly slower pace, hitting its lowest — a 20.6% reduction — just after schools officially closed and the national stay-at-home order came into effect.
On March 19 and 20 respectively, Netflix and YouTube announced that they would reduce the default bitrates of their video streams in Europe. This does not seem to have caused any significant improvements in internet speed in France, but might have kept it from deteriorating further.
Spain
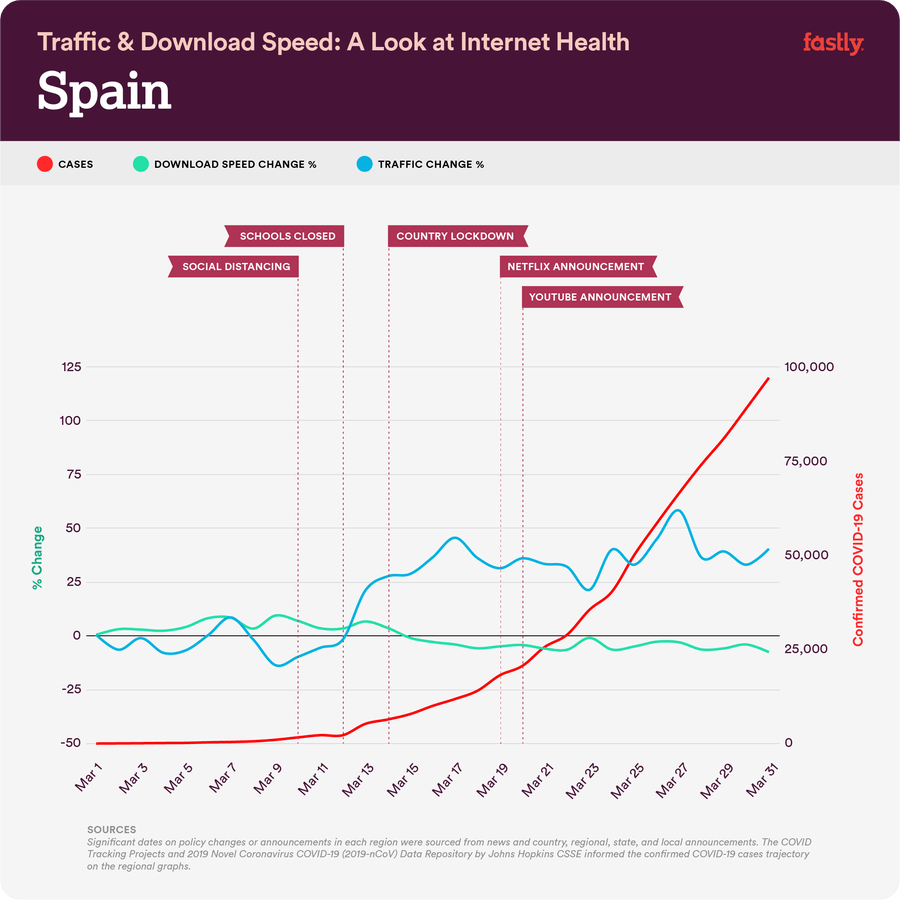
Using traffic and average download speed on March 1 as a baseline, Spain’s traffic increased by 39.4% in March, and download speed decreased by 8%.
There were two traffic increases of note here — a 26.2% surge following school closures on March 12 and a 7.6% jump brought on by the national stay-at-home order on March 14. While download speed was not affected by the school closures, the stay-at-home order coming into effect resulted in a 7.5% reduction.
Similar to France, the video quality reduction by Netflix and YouTube did not seem to bolster internet speed in Spain, but it might have prevented further degradation.
United States
Because policy shifts varied state-by-state, we analyzed four states hit hard by COVID-19 during the month of March: New York and New Jersey (combined into one region given the fluid travel of those living and working in the area) along with California and Michigan.
New York and New Jersey
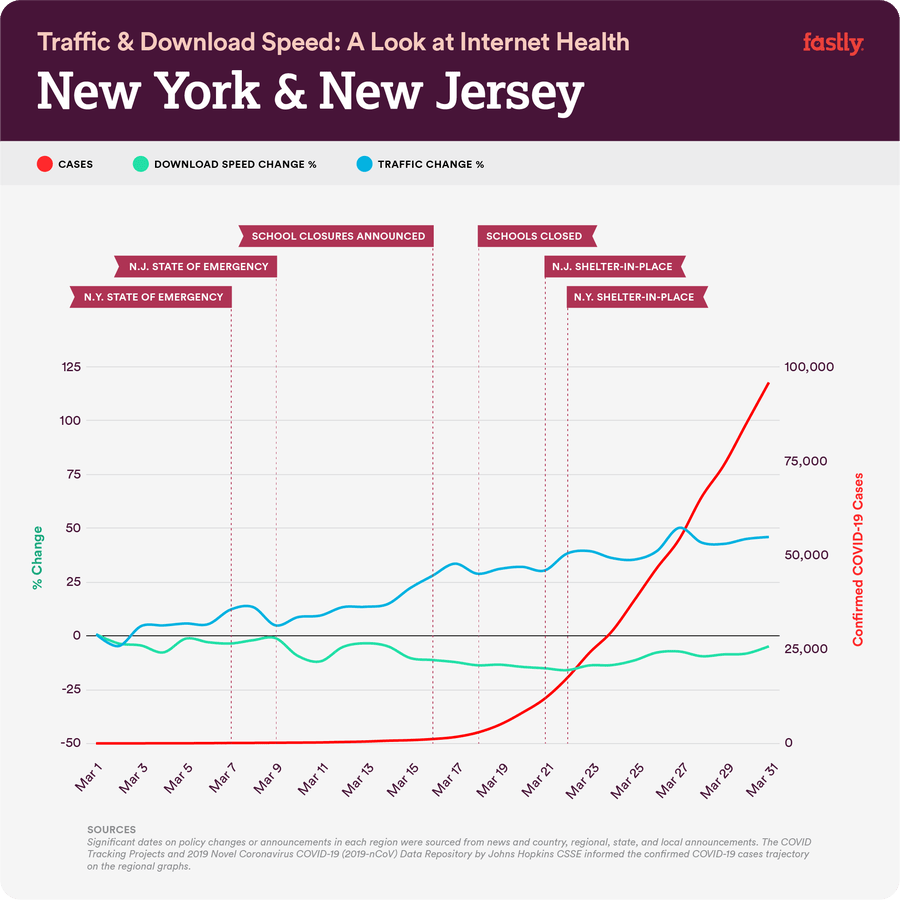
Using traffic and average download speed on March 1 as a baseline, traffic in New York and New Jersey increased by 44.6% during the month of March, and download speed decreased by 5.5%.
Following school closure announcements on March 16, traffic increased by 18.5%, with a parallel, more gradual decrease in download speed of 7.2% as families became increasingly homebound. The states’ shelter-in-place policies triggered a smaller traffic increase of 7.2% on March 23 with no corresponding reduction in download speed, likely because most internet use had already shifted to homes by then.
California

Using traffic and average download speed on March 1 as a baseline, traffic in California increased by 46.5% in March, while download speed remained largely unchanged, actually increasing by 1.2%. The state’s internet infrastructure seems to have absorbed this increase in traffic brought on by the population shift towards home.
Two school closure dates resulted in two small, corresponding increases in traffic: 11.4% upon the closure of Bay Area schools on March 16, and 4.3% following the closure of the state’s remaining districts on March 19. The Bay Area closures triggered a reduction in download speed of 9.8% while the statewide closures did not cause a noticeable drop in performance. By the end of the month, download speed seems to have recovered completely.
Michigan
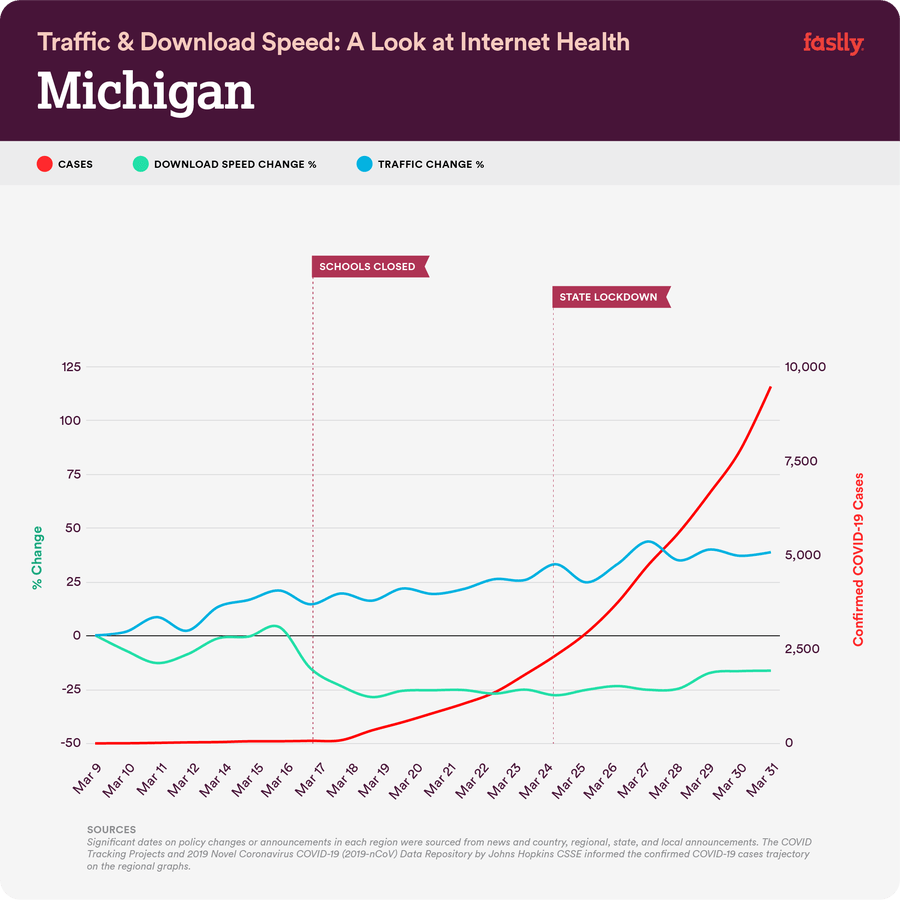
Using traffic and average download speed on March 1 as a baseline, traffic in Michigan increased by 37.9% during the month of March, and download speed decreased by 16.1%.
Interestingly, neither the school closure nor the shelter-in-place policy resulted in significant increases in Michigan’s traffic load. However, download speed decreased with school closures by a remarkable 31.8%. This might reflect that most of the state’s population became homebound with school closures.
The internet is up to the challenge.
Based on our regional analysis, we can confidently say that the internet is holding up quite well despite experiencing a persistently increased load — handling traffic increases upwards of 40% in some cases despite speed reductions.
Traffic increases are typically triggered by public policy announcements.
One trend that occurred nearly across the board is an upward swing of traffic directly following public policy announcements and enactments. These spikes are most visible following school closures in Italy, Japan, France, and Spain, and stay-at-home orders taking place in Italy, the UK, and Spain. This is potentially caused by residents of each region taking to the internet to learn more about those policies, when they go into effect, and what it means for their community and family.
Quality degradation is more gradual, and seems to be triggered by populations shifting homeward.
Internet health seems to decrease markedly as school closures, shelter-in-place policies, and stay-at-home orders officially take effect. This is likely because traffic is both increasing and moving rapidly to residential networks, giving regional residential ISPs little time to react. This is the case across the board in the regions examined above, but is most noticeable in France and Michigan, with 35.4% and 16.1% speed reductions, respectively, as the populations became homebound.
We note that those who had poor internet connections to begin with may notice greater degradation than those who had good-quality broadband.
For context, someone with a high-quality, 100Mbps internet connection might not even notice a download speed reduction of 35% — a typical 1080P video stream requires just 6Mbps and fits well within the resulting 65Mbps. However, someone with a lower-quality connection, say 10Mbps, might notice some quality degradation: their typical 1080P movie might now automatically adjust down to 720P to fit well within the resulting 6.5 Mbps.
The good news is, these effects are regional – quality degradations seem to be strongly correlated with regional policy and population shifts — and speeds are unlikely to decrease much further for regions that are now under some sort of shelter-in-place or stay-at-home order. Plainly put, in many of these regions, the majority of those who are able to stay home are already there, meaning that the most extreme cases of speed degradation have already occurred.
The line between weekdays and weekends has disappeared.
Traditionally, weekend traffic is highly distinguishable from weekday traffic, noted by a two-day hump in traffic, illustrating an increase in usage. You can see, especially in the cases of Japan and the UK, where that signature has been eliminated completely. From a traffic perspective, the weekday/weekend delineation is now lost (which likely reflects how many people are experiencing time as well).
The internet has fared well thus far, thanks to elasticity.
With increased traffic and population shifts to increased internet use from home, our data suggests that many users are now experiencing lower download speeds than a month ago. Thankfully, most of today’s websites and internet applications are resilient to these reductions because they are elastic — built to adapt to network conditions and adjust their quality as needed. With congestion control managing connection speed to match available bandwidth, and with application developments such as adaptive bitrate streaming — one of the four key innovations that prepared the internet for COVID-19 — the web and internet applications will continue to work under these new conditions. Websites may take a bit longer to load, and streaming video may play with reduced quality where and when necessary, but they will all continue to work.
News, streaming, and social media have seen significant upticks in traffic.
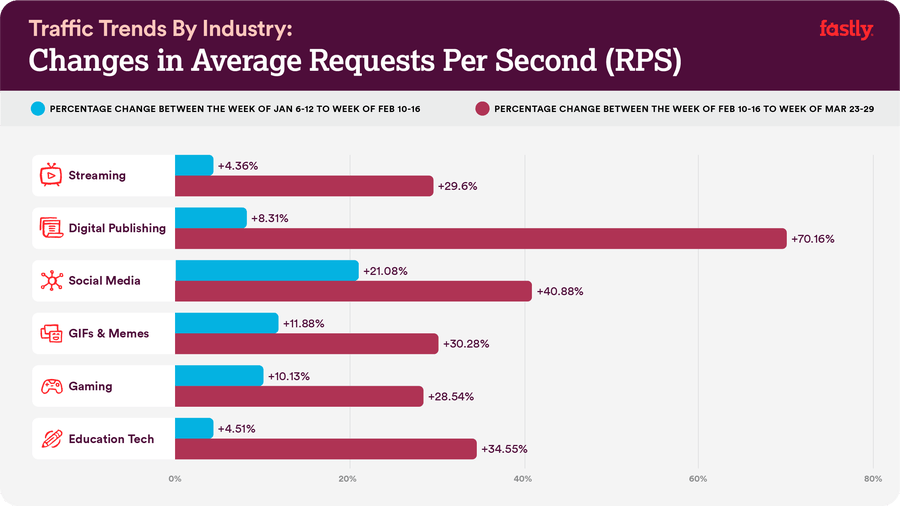
On top of regional trends, we also examined which types of apps and sites comprised this new, sustained traffic load. To do this, we broke down traffic by industry vertical, looking at average percentage increases of requests per second (RPS) — a metric that correlates to overall internet activity — over February and March.
News and digital publishing
Many industries are seeing a boost, but none more than news and digital publishing. News and publishing sites averaged a 70.16% increase in RPS globally between February and March, as the world went online to gather information about how the pandemic was affecting both the world and our hometowns alike.
Streaming
Video streaming services saw a 29.6% increase between February and March. With theaters closing their doors due to shelter-in-place and stay-at-home orders, many streaming services brought movies that were meant to open on the big screen straight to our living rooms. For families now home together all day, streaming offers both a reprieve from the headlines and a break for working parents trying to keep up productivity.
Gaming
Another major source of entertainment, the gaming industry saw a 28.54% increase in RPS between February and March. This includes both game downloads and gameplay, including the ability to speak with fellow gamers via VOIP.
Social media
As a way to connect with friends and family while keeping a safe distance, RPS across social media was up an average of 40.88% between February and March. And, adding a bit of personality to those interactions, GIF and meme generators saw an average RPS increase of 30.28% over that same time period.
Education technology
Second only to news and digital publishing, education technology brands experienced an average RPS increase of 34.55% between February and March, as more and more families sought out resources for homeschooling and virtual learning.
The internet is resilient. And so are we.
Many regions across the globe experienced unprecedented traffic during the onset of the COVID-19 pandemic. But the elastic nature of the web has helped enable us to make changes that are necessary to keep one another safe. As communities remain home, that same adaptability will allow us to connect, learn, and work until we’re able to be together once again.
At Fastly, we’re planning for the capacity needed in this new remote-first world and ensuring that our customers, employees, and nonprofit partners are well supported during this time. We’ll continue to provide traffic and performance updates here on our blog as the pandemic evolves, and maintain information about current network health on our status page.
Methodology and sources
For analysis of regional traffic, Fastly used the following metrics, which were gathered from sampled TCP connection stats (tcp_info) at connection close time as part of Fastly’s fleet-wide performance monitoring infrastructure:
Traffic represents the average number of data bytes per day that were delivered to various geographies from all of our servers (acked_bytes field in tcp_info).
Download speed represents the delivery rate reported by TCP over all connections from a region, averaged over a day (delivery_rate field in tcp_info). While the reported values are averages, various percentiles for download speeds all show similar trends and ratios to the average.
For global analysis of verticals, Fastly measured average requests per second (RPS) recorded at all our servers. RPS is a count of requests received at our serves from end users every second.
Significant dates on policy changes or announcements in each region were sourced from news and country, regional, state, and local announcements. The COVID Tracking Project and 2019 Novel Coronavirus COVID-19 (2019-nCoV) Data Repository by Johns Hopkins CSSE informed the confirmed COVID-19 cases trajectory on the regional graphs.
For those interested in even more detail: After much investigation of TCP metrics, including loss rate estimates, RTT, and the congestion window, we found delivery_rate to reflect download speed reasonably well by tracking load increases when expected. For a given connection at a given point in time, this metric reflects an instantaneous rate, and it should be filtered to get a robust estimate of bandwidth. For instance, the BBR congestion controller uses a max filter over these instantaneous estimates within a connection. We use an average filter over individual estimates, where each estimate is the per-minute average of the final delivery_rate estimate of connections that terminated in that minute.
Forward-looking statements
This article contains “forward-looking” statements that are based on Fastly’s beliefs and assumptions and on information currently available to Fastly on the date of this article. Forward-looking statements may involve known and unknown risks, uncertainties, and other factors that may cause its actual results, performance, or achievements to be materially different from those expressed or implied by the forward-looking statements. These statements include, but are not limited to, those regarding the internet’s ability to handle increased activity and the likelihood of future degradation of internet quality, the health or resiliency of the internet, the continued ability of website and streaming video sites to function, the correlation between internet quality and regional stay-at-home orders, and the continuation of any of the trends described above including increased activity in informational and entertainment verticals. Except as required by law, Fastly assumes no obligation to update these forward-looking statements publicly, or to update the reasons actual results could differ materially from those anticipated in the forward-looking statements, even if new information becomes available in the future. Important factors that could cause Fastly’s actual results to differ materially are detailed from time to time in the reports Fastly files with the Securities and Exchange Commission (SEC), including in its Annual Report on Form 10-K for the year ended December 31, 2019. Copies of reports filed with the SEC are posted on Fastly’s website and are available from Fastly without charge.