
Our first OpenTelemetry library for Compute is now available, enabling your Compute application to generate spec-compliant traces, providing deeper insights about its performance and resources. In this post I'll show you how easy it is to add this support to an edge application.
Our Compute platform runs WebAssembly modules across our global network of edge servers, compiled from a language of your choice. Currently, we provide official support for Rust, AssemblyScript, and JavaScript, but ingenious customers have shipped apps written in C++, Swift, and Zig too!
OpenTelemetry provides library support for many of these languages, giving developers the convenience to work with SDK objects and calls rather than needing to speak in the raw protocol language as we needed to do when we added OpenTelemetry to a VCL service in part 2 of this series. The default exporters provided by OpenTelemetry libraries cannot be used directly because (for safety) Compute limits communication with the outside world to the host calls we expose through our SDKs. Still, thanks to OpenTelemetry’s modular approach, we are able to extend the official OpenTelemetry libraries with Compute-compatible components.
This has enabled us to work on supporting OpenTelemetry on Compute, starting with JavaScript.
Setting up a collector
Before we discuss emitting data, we need a collector that accepts the traces your application will send. In a production architecture, you would have an OpenTelemetry collector with an OTLP over HTTP receiver enabled, running on some server reachable from your application. The collector, in turn, exports its data to a backend. OpenTelemetry can export to many types of backends, such as to instances of Jaegar or ZipKin, or to services, such as Honeycomb.
When you’re experimenting locally, the easiest way to get a collector running is to use the OpenTelemetry Collector Demo, which spins up a collector, as well as a number of backends, like Jaeger. The screenshots in this article are taken using this setup and are from Jaeger UI.
To use the Collector Demo with the examples in this article, you’ll need Docker, and you’ll need to follow the instructions for running the demo, but with a few changes to its configuration to enable OTLP over HTTP. Modify the otel-collector-config.yaml file to enable the http protocol:
receivers:
  otlp:
    protocols:
      grpc:
      http:   # Add this

exporters:
...
The Collector Demo runs in Docker, so we make the port available, and while we’re at it, we will disable some of its components that we don’t need. Add docker-compose.override.yaml to examples/demo/:
version: "2"
services:
  otel-collector:
    ports:
      - "4318:4318"   # OTLP HTTP receiver
  demo-server:
    profiles:
      - disabled
  demo-client:
    profiles:
      - disabled
With these changes made, start the Collector Demo:
$ cd examples/demo
$ docker-compose up
Once this is running, you’re ready to start sending traces to your collector! The collector exports traces to both Jaeger and ZipKin. Jaeger UI will be available at http://localhost:16686/, or if you prefer, use ZipKin’s UI at http://localhost:9411/.
And now that we are ready to collect data let’s get our hands dirty with OpenTelemetry in Compute!
Adding OpenTelemetry to an application
Typically, a JavaScript application instrumented with OpenTelemetry will add a tracing initialization file (with a name such as 'tracing.js'), which creates instances of the following:
Resource: describes the application to the collector
Instrumentations: modules that hook into platform or framework events to generate instrumentation data
Exporter: a module that can take OTel data and ship it to an external collector somehow
SDK: An agent that wires together all of the above.
I have created a package in JavaScript to implement these for Compute, and we've made it open source and available as @fastly/compute-js-opentelemetry on npm. The package includes the following custom components and more:
Instrumentations for Fastly’s request lifecycle as well as backend fetches from your edge code
A custom exporter that can send OTel data to a collector using Fastly’s backend fetch or real time logging mechanisms
A custom SDK that simplifies the procedure of wiring up the exporter, instrumentations, and resource
To show you how easy it is to add OpenTelemetry, let’s consider a simple Compute application written in JavaScript:
/// <reference types='@fastly/js-compute' />

async function handleRequest(event) {
  const backendResponse = await fetch('https://httpbin.org/json', {
    backend: 'httpbin',
  });

  const data = await backendResponse.text();
  return new Response(data.length, {
    status: 200,
    Headers: {
      'Content-Type': 'text/plain',
    },
  });
}
addEventListener('fetch', (event) => event.respondWith(handleRequest(event)));
This example handles a request by fetching some data from the backend httpbin, then measuring the size of that data and constructing a response to the client containing the result.
To add OpenTelemetry, let’s add @fastly/compute-js-opentelemetry to our project, as well as some OpenTelemetry libraries:
$ npm install @fastly/compute-js-opentelemetry
$ npm install @opentelemetry/resources @opentelemetry/semantic-conventions
These libraries need a handful of polyfills and shims in order to be used on Compute. These can be imported conveniently by applying the helper package @fastly/compute-js-opentelemetry/webpack-helpers during the build process. Modify the webpack.config.js file in your project:
// Reference the helper module
const webpackHelpers = require("@fastly/compute-js-opentelemetry/webpack-helpers");

module.exports = {
  entry: "./src/index.js",
  /* ... other configuration */
};

// Add this line
module.exports = webpackHelpers.apply(module.exports);
Then create a tracing initialization file, tracing.js, which looks like this:
import { Resource } from '@opentelemetry/resources';
import { SemanticResourceAttributes } from '@opentelemetry/semantic-conventions';

import { FastlySDK } from '@fastly/compute-js-opentelemetry/sdk-fastly';
import { OTLPTraceExporter } from '@fastly/compute-js-opentelemetry/exporter-trace-otlp-fastly-backend';
import { getComputeJsAutoInstrumentations } from '@fastly/compute-js-opentelemetry/auto-instrumentations-compute-js';

const sdk = new FastlySDK({
  traceExporter: new OTLPTraceExporter({backend: 'otlp-collector'}),
  instrumentations: [getComputeJsAutoInstrumentations(),],
  resource: new Resource({
    [SemanticResourceAttributes.SERVICE_NAME]: 'my-fastly-service',
  }),
});

await sdk.start();
This looks very similar to a typical tracing initialization file from OpenTelemetry’s Node.js tutorial, but with some components replaced by Compute implementations. The listed exporter assumes a collector registered with the Fastly service as the named backend otlp-collector.
To activate the tracing, import tracing.js in your application:
/// <reference types='@fastly/js-compute' />
import './tracing.js';

async function handleRequest(event) {
...
Now run the application, and just like that, you’ll start getting spans for your requests!
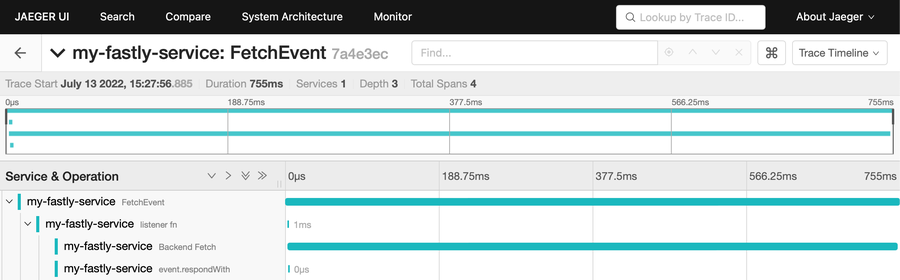
Looking at this trace, we see some interesting things.
First, we see a span for the entire request, represented as a FetchEvent, and child spans for the listener function, the Backend Fetch (to example.com), and the event.respondWith call, making up the graph for one invocation. Notice that the execution of the listener function and event.respondWith are very short. This is because the handler function returns immediately with a promise. By returning a promise from the handler function, Compute services can continue processing after the listener function returns. Our program proceeds with the Backend Fetch during this time. The SDK also takes advantage of this mechanism to extend the life of the event until the data has finished being sent to the collector, abstracting it away, so you don’t need to worry about it.
It's really cool that tracing.js is completely separate from your application’s code. The tracing mechanism and default instrumentations set up in this file are enough to generate telemetry with no knowledge required from your application.
Custom spans
That said, there are times when you want to instrument your code with custom spans and events. Maybe you have a function that you want to mark the start and end times with or want to know how often it’s being called.
Because we are implementing standard OpenTelemetry, you can do that too:
$ npm install @opentelemetry/api/// <reference types='@fastly/js-compute' />
import './tracing.js';
import { context, trace } from "@opentelemetry/api";
async function handleRequest(event) {
const tracer = trace.getTracerProvider()
.getTracer('my-tracer');
const mySpan = tracer.startSpan('my-task');
context.with(trace.setSpan(context.active(), mySpan), () => {
doTask(); // spend some time in a task
});
mySpan.end();
return new Response('OK', {
status: 200,
headers: new Headers({"Content-Type": "text/plain"}),
});
}
addEventListener("fetch", (event) => event.respondWith(handleRequest(event)));The generated trace looks like this:
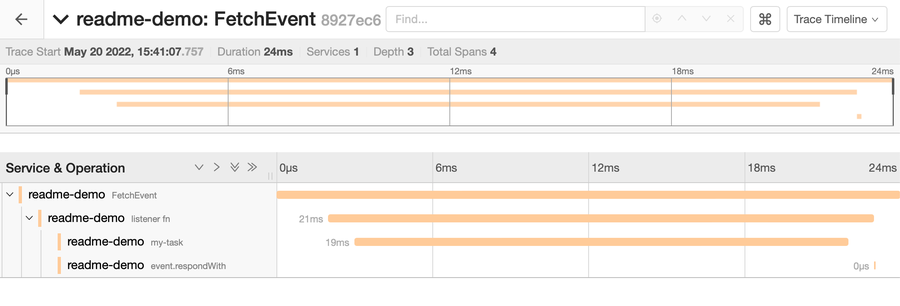
We have no Backend Fetch this time, but instead, we have a custom span called my-task, and we can see that it took 19ms.
The only Fastly-specific code is in the tracing initialization module, and everything we're doing in the main source of the program with OpenTelemetry is done using the standard OpenTelemetry APIs. There is no need for anything special to Fastly here. In fact, any code you incorporate into your Compute application that is already instrumented with OpenTelemetry will work just fine, and the tracing mechanism we set up will pick up that data too.
Trace context propagation
I just said that the tracing mechanism picks up OpenTelemetry data from other code incorporated into your Compute application and generated by your own code. But OpenTelemetry enables us to go one step further and pick up data even from other processes and Web APIs you invoke from your Fastly application.
One thing that makes OpenTelemetry so powerful and attractive is that it allows you to visualize the architecture of your entire system as a whole, with your traces flowing seamlessly between the various components that it comprises, even across processes and servers. What makes this work is trace context propagation, that is, the ability for a trace that starts in one component to propagate its context into other components that it calls into. As we introduced in part 2 of this blog series, this is possible for Web APIs by making use of the traceparent header.
The instrumentations included in @fastly/compute-js-opentelemetry support this mechanism, both for incoming and outgoing requests. This means that if your application is called within the context of an existing trace context, then this library extracts that trace’s information from the incoming request’s headers and uses that trace as the parent for any generated spans. Likewise, if your application makes any backend fetches, then this library inserts the current trace’s context into the request headers when making those fetches. And the best part is, by initializing the tracing mechanism with getComputeJsAutoInstrumentations, these are enabled automatically.
Therefore, by simply calling into APIs that emit OpenTelemetry, you can generate nested traces like this with no additional work:
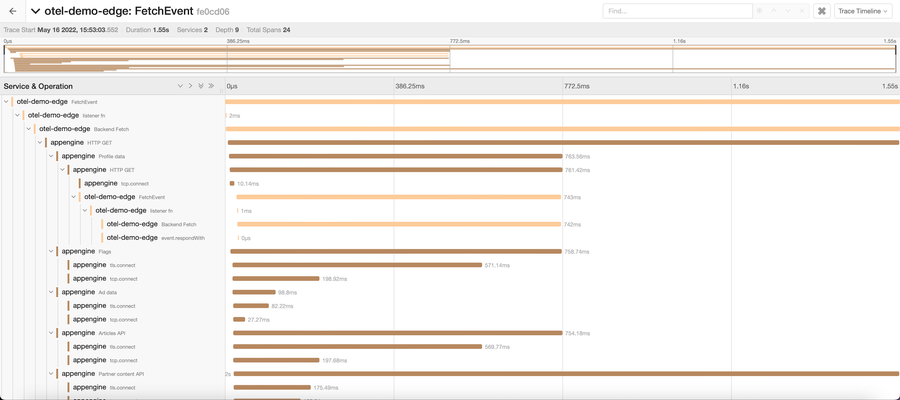
This is the power of OpenTelemetry: as long as all the components emit traces that eventually reach a collector, the collector can piece them all back together to generate these types of graphs, enabling you to trace the entire lifetime of a single end-to-end run of your full application across all its pieces.
All of this data is available to whatever analytics and insight tooling you wish to use. We think our tools will enable you to position Fastly as a first-class citizen in your system architecture.
Current challenges
OpenTelemetry is still pretty new. There are still some rough edges that should smooth out as the official libraries mature and as more and more tools, platforms, and frameworks support it.
One thing, in particular, is that the metrics API and SDK of the JavaScript OpenTelemetry libraries are still in development status. As such, our library can’t fully support metrics at this point. We plan to continue to update our library as the official ones make progress, and we hope to be able to use metrics soon.
Check out the library
Wow, excited about OpenTelemetry? I remember that I sure was when I first saw these trace diagrams being emitted from my own demos! The time is right for you to check out the source code and documentation for the OpenTelementry for Compute JavaScript library described in this article, available at fastly/compute-js-opentelemetry on GitHub.
We’re delighted to be bringing OpenTelemetry to Compute! If you use this library to add instrumentation to your Compute application, we’d love to hear about it. Tell us how it went for you!
And in part 4 of this series, we’ll be looking at a case study on how we’re using OpenTelemetry to instrument our own Fiddle tool. Stay tuned!
All four parts of our OpenTelemetry blog series are now published: