
We are very excited about OpenTelemetry. We wrote about why, and also about how to emit telemetry from Fastly's VCL services, and our new Compute platform. But OpenTelemetry's value truly shines when you add it to everything in your stack. What does that look like and is it worth it? We instrumented Fastly Fiddle, from top to bottom, to find out.
It's nice to know that you can generate OpenTelemetry data at the edge, but if you're not yet on board with unified observability across your entire stack, you might be wondering if it's worth it. We can only really answer that question by showing the effect of instrumenting a whole system. So in this post I'm going to lay out how we instrumented Fiddle, what the resulting traces look like and what insights it can reveal.
Fiddle comprises a ReactJS application in the browser, a NodeJS backend, and a Fastly VCL service. It also reaches out to several other internal systems and other Fastly services. Its architecture is complex and demanding to grasp.
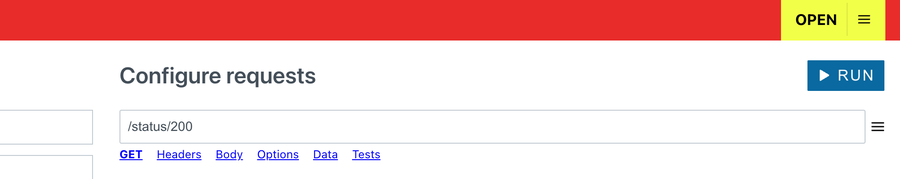
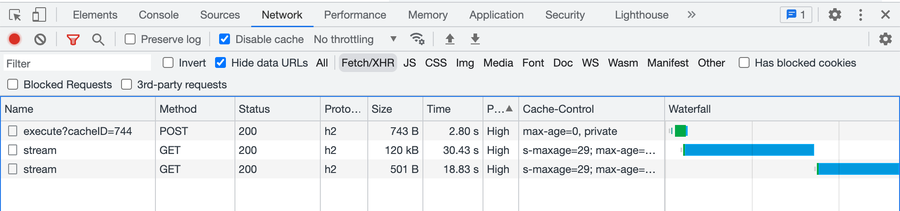
When you click the RUN button of a Fiddle in the browser, you don't just make one HTTP request. The React app makes an initial API call to start an execution session, and gets back an ID. It then uses that ID to connect to a stream where we can receive the instrumentation data from the server as it becomes available. At some point there's no more data available, or the session times out, and the execution ends. That's the full lifecycle of a Fiddle execution.
Tracing works on the principle of "spans" (of time), which take the form of a tree (it's a tree because a span can have multiple children but only one parent). The 'root span' describes the period of time taken up by the overall task or transaction, and child spans then break that down into more granular activities.
I set out to add tracing to Fiddle, with the objective of getting a trace for an execution which covered all the components of the platform that are touched by that process. Enough already, let's skip to the payoff:
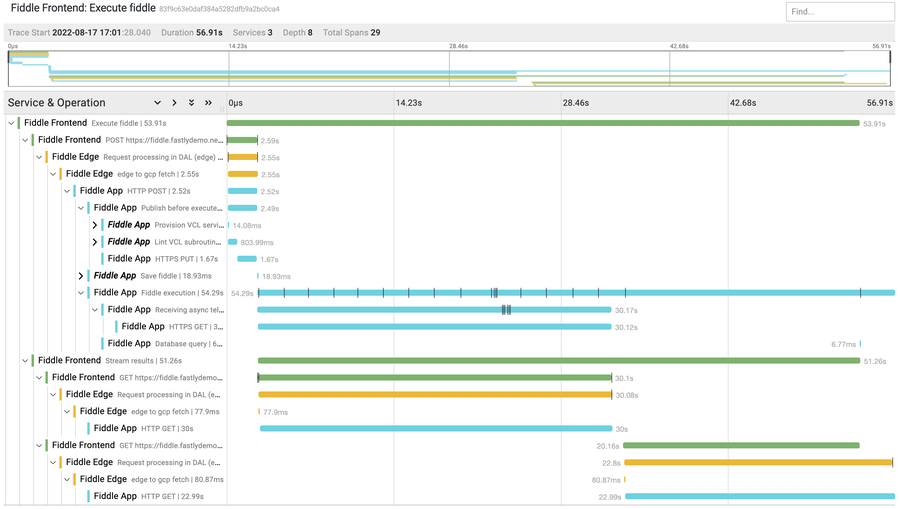
Voilà! A single interactive visualization that documents a Fiddle execution, covering the multiple front end requests, edge proxying, server processing, database queries, and instrumentation calls to internal microservices.
How did we do this? Let's break it down.
Initializing telemetry (starting with React)
Let's start by creating a tracing configuration for the React.JS front end in a new file called tracing.ts:
import { Span, SpanStatusCode, Context } from "@opentelemetry/api";
import { WebTracerProvider } from "@opentelemetry/sdk-trace-web";
import { Resource } from "@opentelemetry/resources";
import { SimpleSpanProcessor } from "@opentelemetry/sdk-trace-base";
import { OTLPTraceExporter } from "@opentelemetry/exporter-trace-otlp-http";
import { ZoneContextManager } from "@opentelemetry/context-zone";
import { FetchInstrumentation } from "@opentelemetry/instrumentation-fetch";
import { FetchError } from "@opentelemetry/instrumentation-fetch/build/src/types";
import { registerInstrumentations } from "@opentelemetry/instrumentation";
import { SemanticResourceAttributes } from "@opentelemetry/semantic-conventions";

const resource = new Resource({
  [SemanticResourceAttributes.SERVICE_NAME]: "Fiddle Frontend",
});
const provider = new WebTracerProvider({ resource });
const exporter = new OTLPTraceExporter({
  url: process.env.REACT_APP_OTEL_HTTP_COLLECTOR_BASE_URL + "/v1/traces",
});

provider.addSpanProcessor(new SimpleSpanProcessor(exporter));
provider.register({ contextManager: new ZoneContextManager() });
This looks pretty similar to the setup we used in Computefor the last post. OpenTelemetry provides a lot of separate libraries that we need to use together, but ultimately most of the complexity is confined to this file. Here's how the pieces fit together:
Resource: Defines the application;
Exporter: Sends serialized span data to a collector endpoint;
Span processor: Serializes span data and passes it to an Exporter;
Context manager: Keeps track of what the current active span is so that parts of the application that are instrumented don't need to know about each other (To handle tracking context through async operations in the browser, OTel uses zone-js and exposes it as
ZoneContextManager);Provider: Hooks into the runtime to register an implementation of the OpenTelemetry API.
When code in the application calls the OTel API to create spans, the provider uses context from the context manager, creates the span, and passes it to the span processor to serialize and export.
This feels pretty complicated, but it makes sense because it's important that the OpenTelemetry API can be called from anywhere in the application and meet two critical requirements:
The calls will not error even if there's no tracing configuration in the application
Spans created from these calls will nest inside each other without having to know anything about their parent or child spans.
Why is this important? It's because I'm not the only one who might make OpenTelemetry calls in my application. There are three ways spans can be generated:
Your code: Explicitly in your own code via
OTelAPI.tracer.startSpan(...).Dependencies: The author of a dependency that you're using in your app has included some
OTelAPI.tracer.startSpan(...)calls in their code (and they'll have listed the OpenTelemetry API as a dependency of their module).Instrumentation modules: OpenTelemetry "instrumentation" modules can be registered with the provider, generally to retrofit telemetry to standard features of the platform like HTTP calls.
When we add explicit spans around long-running tasks in our code, we could pass context (ie. the parent span) around manually but that won't help us with operations that happen in dependencies (2) or which OpenTelemetry is monitoring via an instrumentation module (3). These kinds of autonomously-constructed spans will pick up the active context automatically from the context manager. And dependencies that ship with built-in telemetry have no idea if we're even using OpenTelemetry in our app at all, so the OpenTelemetry API itself is intentionally just a type definition with no implementation.
It's like by adding spans to your code, you're creating a kind of "inspection hatch", the potential for something or someone to take a look if they want to. But it's only when a provider is registered that the OpenTelemetry API actually does anything.
We won't really know if any of our dependencies are emitting telemetry until we collect it, render the trace, and find out. The instrumentation modules, however, are added manually in the tracing config file. For Fiddle's browser app, we primarily want to instrument the fetch API, so we add this to the tracing.ts file:
registerInstrumentations({
  instrumentations: [
    new FetchInstrumentation({
      propagateTraceHeaderCorsUrls: /.*/g,
      clearTimingResources: true,
      applyCustomAttributesOnSpan: (
        span: Span,
        request: Request | RequestInit,
        result: Response | FetchError
      ) => {
        const attributes = (span as any).attributes;
        if (attributes.component === "fetch") {
          span.updateName(
            `${attributes["http.method"]} ${attributes["http.url"]}`
          );
        }
        if (result.status && result.status > 299) {
          span.setStatus({ code: SpanStatusCode.ERROR });
        }
      },
    }),
  ],
});
Now the telemetry configuration is complete, and any application code that calls into the OpenTelemetry API to create spans, along with any calls to fetch, will trigger the provider to do its thing.
Adding spans around React code
Finally, we need to add our own custom spans. The principle of separating OpenTelemetry's provider configuration from the API applies to our own use of the API too, so in our application code we don't actually need to import anything from tracing.ts. Instead, we are supposed to call the OpenTelemetry API independently. Here's how it might feature in a React functional component:
import OTel from "@opentelemetry/api";

const oTelTracer = OTel.trace.getTracer("Foo");

const Foo: FunctionComponent<Props> = () => {

  const openStream = (): void => {
    await oTelTracer.startActiveSpan("Stream results", async (span) => {
      // ... do slow stuff, HTTP calls etc
      span.end();
    });
  };

  // ... rest of component code

};
This can quite quickly get laborious though. For example, OpenTelemetry's docs recommend catching errors and assigning them to the span, which would give us this, for every span in the code:
import OTel from "@opentelemetry/api";

const oTelTracer = OTel.trace.getTracer("Foo");

const Foo: FunctionComponent<Props> = () => {

  const openStream = (): void => {
    await oTelTracer.startActiveSpan("Stream results", { attributes: { url }}, async (span) => {
      try {
        // ... do slow stuff, HTTP calls etc
      } catch (ex) {
        span.recordException(ex);
        span.setStatus({ code: opentelemetry.SpanStatusCode.ERROR });
      }
      span.end();
    });
  };

  // ... rest of component code

};
There's other untidiness too. We have to call getTracer() to get the object on which we can call startActiveSpan – and OpenTelemetry recommends doing this only when you need it:
It’s generally recommended to call getTracer in your app when you need it rather than exporting the tracer instance to the rest of your app. This helps avoid trickier application load issues when other required dependencies are involved
And look at that second argument to startActiveSpan: { attributes: { ... } }, that's a SpanOptions, which allows customization of things like the span's "kind", or to provide a custom start time. But mostly we're just going to want to provide custom attributes so it's annoying to have to nest these inside an attributes key...
It's starting to look like we might want to abstract this a bit, but first we need to consider some more complex edge cases where the context can't be detected automatically from the context manager.
Manual context propagation
In Fiddle, when we trigger an execution, we want the root span to cover a set of async activities that happen quite far down the component tree. The POST request below happens in the root <App> component, while the requests to stream the results for the same execution happen in a <Result> component. Yet we need them to nest like this:
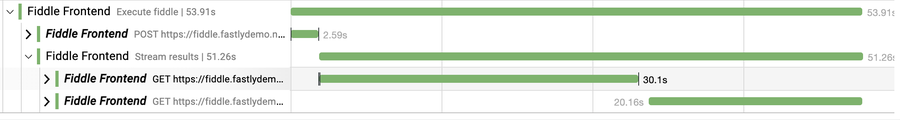
I haven't found any better way to do this than reading the new context and then passing it into a component. For example, in the high level <App> component, we set the span and the new active context that is associated with it into a React state hook:
oTelTracer.startActiveSpan("Execute fiddle", async (span) => {
  // ... do stuff here
  setExecutionSession({
    id: sessionID,
    telemetry: { span, context: OTel.context.active() }
  });
  // <-- Intentionally not ending the span here
});
That state is then passed down into child components via props, and can be used even after the active context has changed, either to attach a child span to it:
oTelTracer.startActiveSpan("Stream results", {}, props.session.telemetry.context, async (childSpan) => {
  // ... do work
  childSpan.end();
});
… or to end the span itself:
props.session.telemetry.span.end();This reveals a bit more boilerplate: in these kinds of scenarios, the new span comes as a parameter to the callback, but we have to call context.active() from the OTel API to get the new context. This feels like a bit of a gotcha!
An abstraction for trace calls
So I decided to make a utility function and add it to tracing.ts, but actually export it so we can use it where we want to do tracing.
Ideally I wanted a function that would always take a tracer name and span name, and then optionally a set of attributes and a parent context, and finally a callback function. If the provided callback expects two arguments, I will call it with the new span and context, and expect it to end the span itself. If the callback expects no arguments, then I'll end the span when the promise returned by the function resolves.
Here's what I came up with in a new telemetry-utils.ts file:
import OTel, { Attributes, Span, Context, SpanStatusCode } from '@opentelemetry/api';

type TracedCallback<T> = (span?: Span, context?: Context) => T;

export async function traceSpan <T>(tName: string, sName: string, arg3: Attributes | Context | TracedCallback<T>, arg4?: Context | TracedCallback<T>, arg5?: TracedCallback<T>): Promise<T> {
  const attrs = arguments.length >= 4 ? arg3 as Attributes : {};
  const parentContext = arguments.length == 5 ? arg4 as Context : OTel.context.active();
  const callback = (arguments.length == 5 ? arg5 : arguments.length == 4 ? arg4 : arg3) as TracedCallback<T>;
  const tracer = OTel.trace.getTracer(tName);
  const handlesSpanEnd = callback.length;
  return tracer.startActiveSpan(sName, { attributes: attrs }, parentContext, async (span) => {
    const boundCallback = (handlesSpanEnd) ? callback.bind(null, span, OTel.context.active()) : callback;
    try {
      const result = await boundCallback();
      if (!handlesSpanEnd) span.end();
      return result;
    } catch (e) {
      span.recordException(e);
      span.setStatus({ code: SpanStatusCode.ERROR });
      span.end();
      throw e;
    }
  });
}
Now, I can import and re-export that module in my tracing.ts file:
export * from "../telemetry-utils";And I can now call traceSpan in simple scenarios like this:
import { traceSpan } from "./lib/telemetry";

const Foo: FunctionComponent<Props> = () => {

  const openStream = (): void => {
    await traceSpan("Foo", "Stream results", { url }, async () => {
      // ... do slow stuff, HTTP calls etc
    });
  };

  // ... rest of component code

};
I no longer have to end the span explicitly, because I'm not receiving any params in the callback. Attributes don't have to be nested, and we don't have to pre-initialize a tracer, we can just pass the tracer name in as the first argument. And I get error handling automatically.
More complex scenarios work too:
import { traceSpan } from "./lib/telemetry";

const Foo: FunctionComponent<Props> = () => {

  const openStream = (): void => {
    await traceSpan("Foo", "Execute fiddle", {}, async (span, context) => {
      setExecutionSession({
        id: sessionID,
        telemetry: { span, context }
      });
    });
  };

  // ... rest of component code

};
Here, because my callback accepts two arguments, the span doesn't end automatically and it's up to me to end it - which could even mean sticking it in a React state hook or component prop and ending it later from somewhere else in the app. Having access to the context means I can also explicitly start new spans that have this one as their parent.
In all cases we now get error handling in the trace, we are using a fresh tracer instance (as advised by the OpenTelemetry docs) and there's minimal boilerplate.
Can you trust front-end traces?
In short, no. All my traces go to an instance of an OpenTelemetry Collector configured to support OTLP JSON over HTTP, and I'm exposing that server behind a Fastly service so that I can dispatch the traces to the same origin from which I serve my site. Of course, anyone can submit trace data to this endpoint, so if that's a problem, one way to resolve it is to discard any traces that don't also include spans from the backend.
So far I've only figured out how to do that retroactively, but I feel like this could be done in the collector, or even in the Fastly service fronting the collector.
Tracing the NodeJS backend
That same traceSpan function can be used identically in NodeJS. However, we need slightly different libraries to configure the tracing, which is why I kept the tracing.ts and tracing-utils.ts files separate.
Now I can create a new tracing.ts file for my server-side tracing config:
import { registerInstrumentations } from "@opentelemetry/instrumentation";
import { getNodeAutoInstrumentations } from '@opentelemetry/auto-instrumentations-node';
import { Resource } from '@opentelemetry/resources';
import { SemanticResourceAttributes } from '@opentelemetry/semantic-conventions';
import { SimpleSpanProcessor } from "@opentelemetry/sdk-trace-base";
import { NodeTracerProvider } from "@opentelemetry/sdk-trace-node";
import { OTLPTraceExporter } from "@opentelemetry/exporter-trace-otlp-http";

const oTelResource = new Resource({
  [SemanticResourceAttributes.SERVICE_NAME]: 'Fiddle App'
});

const traceExporter = new OTLPTraceExporter({ url: process.env.OTEL_HTTP_COLLECTOR_BASE_URL + "/v1/traces" });
const spanProcessor = new SimpleSpanProcessor(traceExporter);
const traceProvider = new NodeTracerProvider({ resource: oTelResource });

traceProvider.addSpanProcessor(spanProcessor);
traceProvider.register();

registerInstrumentations({ instrumentations: getNodeAutoInstrumentations() });

export * from "../telemetry-utils";
The differences here are fairly straightforward:
Instead of
FetchInstrumentation, we usegetNodeAutoInstrumentationsfrom @opentelemetry/auto-instrumentations-node, a nifty library that instruments NodeJS server frameworks like Fastify and Express.JS (which is what Fiddle uses)Instead of the
WebTracerProvider, we use aNodeTracerProvider
And one thing that's really cool is that my server-side telemetry.ts can import and re-export exactly the same custom traceSpan function that my client side React app is using.
Now I can add the same style of traceSpan calls in my Express.JS backend:
import { traceSpan} from './lib/telemetry';

app.put('/fiddle/:id, parseJson, async (req, res, next) => {
  const fiddle = await Fiddle.get(req.params.id);
  fiddle.updateFrom(req.body);

  await traceSpan("Server", "Publish on save", () => fiddle.publish());
  await fiddle.save();

  res.json({
    fiddle,
    valid: fiddle.isValid(),
    lintStatus: fiddle.lintStatus
  });
});
And, like with the front end, there are cases where I don't want the span to end when my async function's promise resolves, in which case I can opt to receive two arguments in the callback and then call span.end() explicitly.
An edge sandwich
The React app on the front end and the NodeJS app on the backend are part and parcel of the same distributed system, and Fastly is sitting in between them. As I said in part one of this series, one of the best things about OpenTelemetry is the ability to recognize the Fastly hosted components of your system as part of the same overall architecture.
We've covered how to add Fastly into your OpenTelemetry picture extensively already in parts 2 and 3 of this series, so go read those to find out:
This post hopefully gives you a sense of the benefits of getting OpenTelemetry visibility into Fastly services when it's combined with the other non-Fastly components of your system.
Next steps
This is enough to demonstrate what I set out to achieve in this post, but I actually haven't instrumented every part of Fiddle: Computefiddles use compiler and runtime microservices, and both Compute and VCL fiddles use an instrumentation proxy to inspect backend fetches. All of this is ripe for instrumentation to make a richer OpenTelemetry picture.
I'd love to know if you're getting OpenTelemetry data from your Fastly service, and what you're doing with it. Reach out to us on Twitter to let us know!
All four parts of our OpenTelemetry blog series are now published: