
Observations at-a-glance
Increased internet usage due to COVID-19 drove a ‘COVID bump’ in traffic across certain industry verticals, including digital media publishing, education, and social media.
The end of summer vacation drove an August increase in online retail traffic across the Americas, EMEA, and APAC regions, but only the Americas and EMEA saw increased traffic aligned with the holiday shopping season.
Events associated with the 2020 US presidential election were visible online, driving increased meme sharing, social media, and digital media publishing traffic.
While many across the world depend on the internet in some way as part of their daily routine, few likely foresaw the extent to which it would become indispensable for education, work, commerce, and communication in 2020. As COVID-19 rapidly spread around the world, everyday life was quickly disrupted by stay-at-home orders, ending or pausing in-school education, commutes to the office, and trips to our favorite brick and mortar stores.
Because of its expanded role as a lifeline, internet usage accelerated through the first few months of the year, forming a COVID bump evident in traffic graphs across many verticals. In this post, we review a few interesting observations on traffic* trends observed during 2020 across aggregated Fastly customer traffic data.
US election drives publishing peak

Aggregated traffic across digital media publishing customers saw a nominal increase during March, presumably due to users looking for the latest news and information on the spread of COVID-19 and actions being taken by their local, regional, or national governments. However, the biggest spike in traffic across this customer cohort was related to the US presidential election. The trailing average shown in the graph blunts the true impact of the event — traffic among this customer set doubled on November 3-4 as the world watched closely. (You can see close ups of the data in our election coverage.) The slight dip in traffic seen toward the end of the year aligns with the seasonal dip typical of the week between Christmas and New Years, and is evident across multiple verticals. After spending the last nine months online nearly non-stop, people apparently chose to focus more on offline activities during this week.
Being social
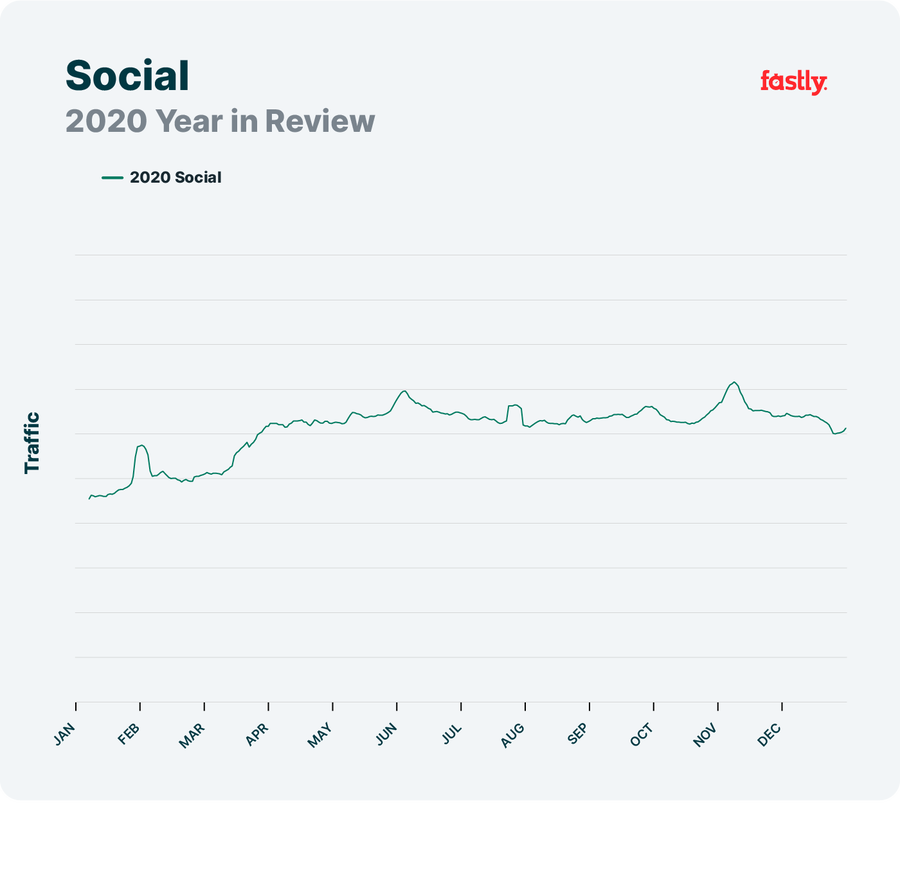
Social media traffic across our platform showed gradual growth through the first half of 2020, but leveled off into the second half of the year. In addition to this long-term traffic pattern, the graph above highlights several traffic spikes, corresponding to the increased usage of social media platforms around major events. Social media played a significant role in the 2020 US presidential election, and as expected, traffic in this vertical saw a clear increase on November 3-4. Regarding the other observed spikes in traffic seen throughout the year, it is hard to say exactly what caused them many months later, but a review of top news stories allows us to make educated guesses about the related events. In late January, traffic built for several days before peaking on the 29th. We believe that this may be related to the helicopter crash that killed nine people including basketball star Kobe Bryant and his daughter days earlier. Social media posts about protests over the killing of George Floyd may have driven the traffic increase seen early June. And the bump in traffic on July 24 may have been caused by posts about the delayed start of the 2020 Major League Baseball season — four months later than expected. The slight dip in traffic seen towards the end of the year, again, aligns with the seasonal dip typical of the week between Christmas and New Year’s.
Meme-able moments
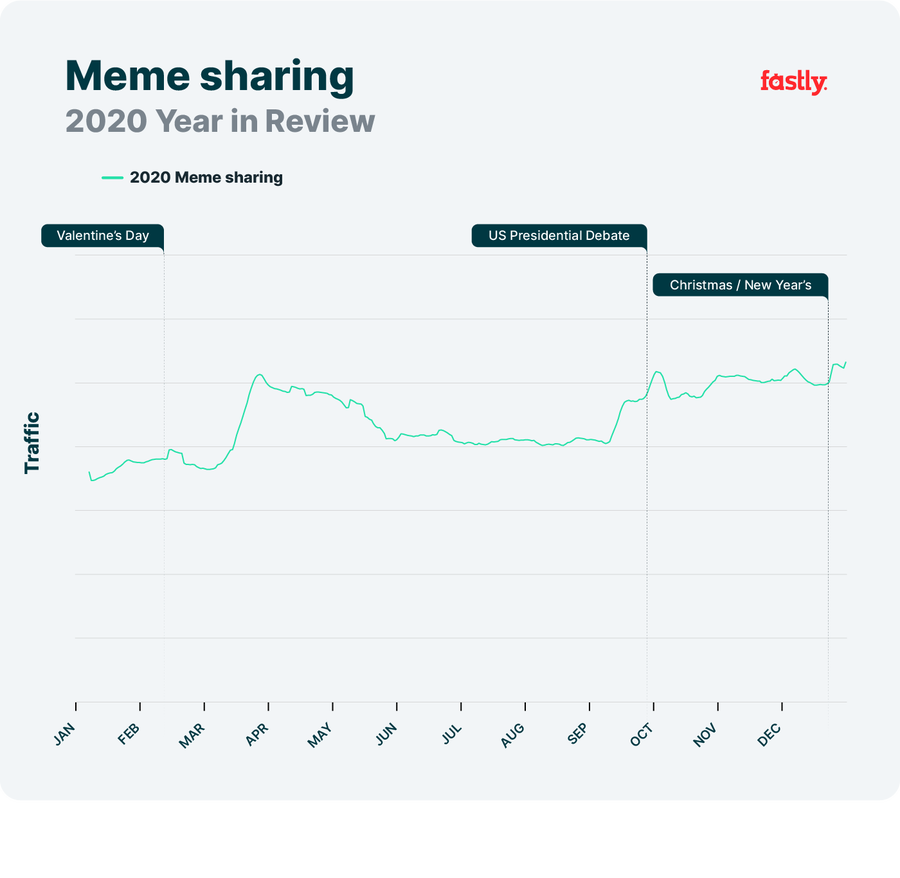
In addition to watching videos and playing games to pass the time, it appears that people also took to creating and sharing memes as they adjusted to stay-at-home life, with a COVID bump clearly evident here across this customer cohort, driving a 45% increase in traffic. The underlying data shows that meme activity also increased around Valentine’s Day (February), the first US presidential debate (September), and Christmas/New Year’s (December).
The world keeps buying, even as physical stores close
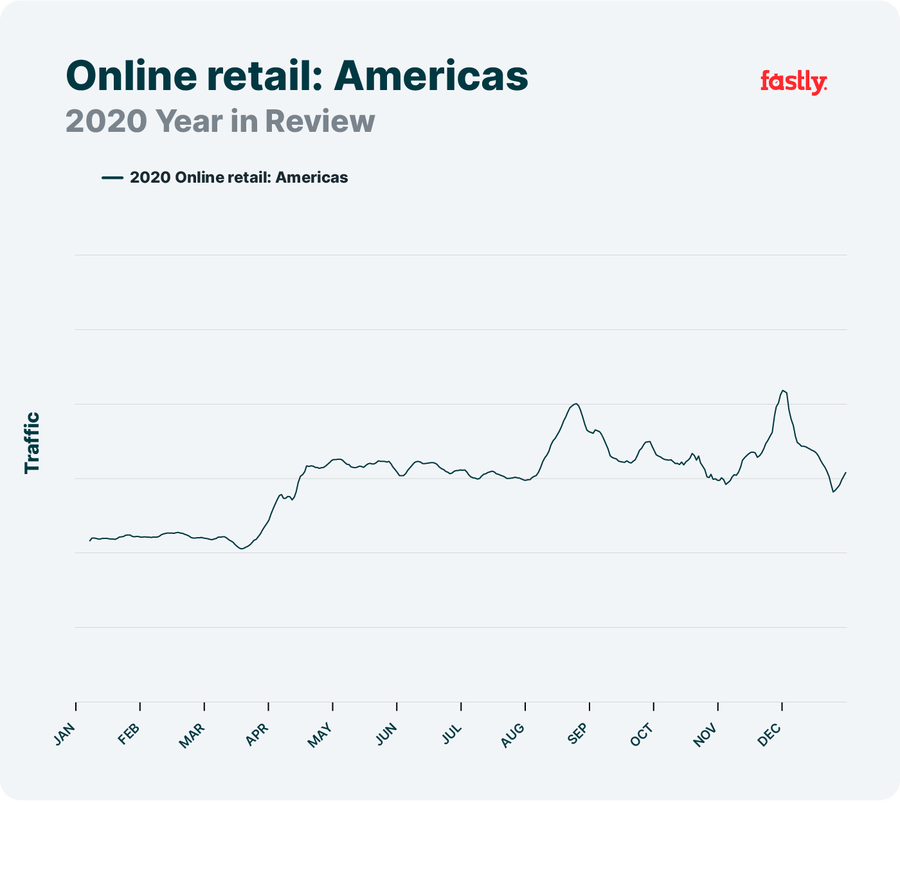
As stay-at-home orders were issued and implemented across the Americas, many stores were either forced to shutter, limit occupancy, or pivot to curbside pickup. These changes drove customers online, either to order from local stores for pickup or delivery, or to increase their purchasing from online retailers. Looking at traffic to North American online retailers, the COVID bump is evident here as shoppers moved aggressively to buying more online, with average 2nd quarter traffic 40% above average traffic in the 1st quarter. In the back half of the year, students returning to school (whether in-person or online) drove a 32% increase over average traffic volumes from the preceding three months (May-July), and there was a 50% increase around the Cyber5 holiday weekend as compared to average traffic during September and October, as shoppers scrambled to place orders ahead of shipping deadlines.
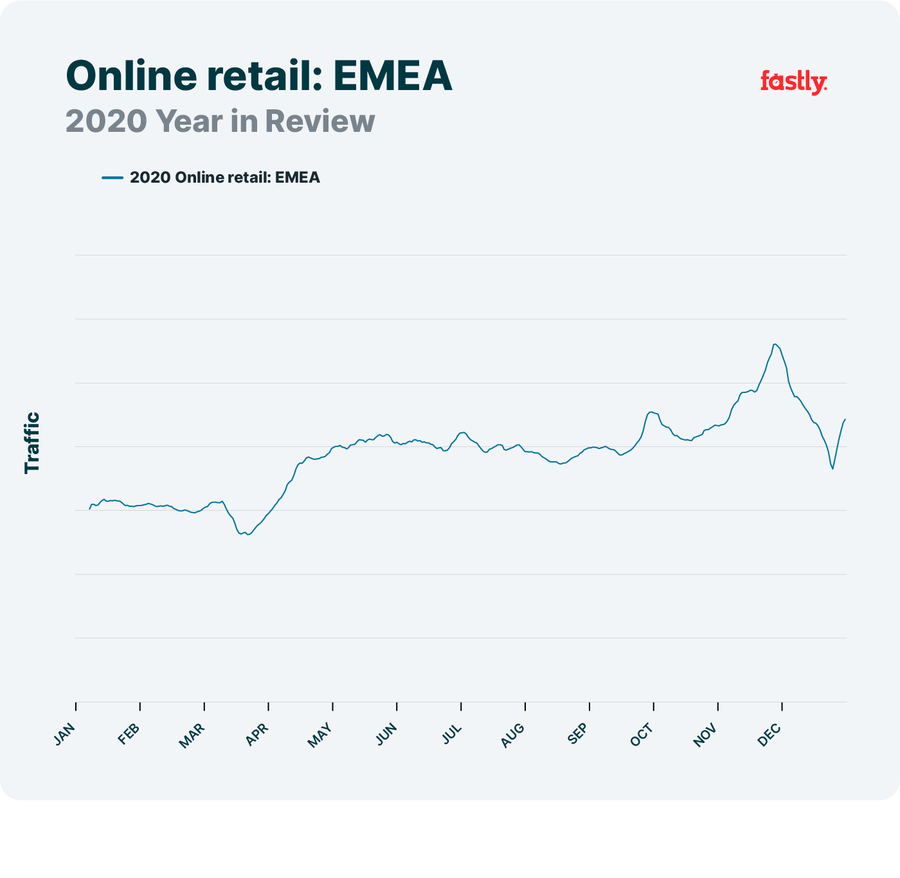
Online retailers in the EMEA region also experienced a COVID bump in traffic, evident in the graph, as wide-scale national lockdowns were implemented, but the 20% drop in traffic (as compared to average traffic levels in January and February) preceding it may have been due to uncertainty around the evolving situation (and thus, reduced spending), or initial implementation of local restrictions, potentially limiting delivery services. A notable bump around the Cyber5 shopping weekend is evident, but traffic dropped rapidly into December, bottoming out at 50% below its peak, again likely due to concerns around shipping times. The underlying data also provides evidence of a traffic increase on Boxing Day, visible in the graph as increasing traffic at the end of the year.

In contrast to the American and EMEA cohorts, online retailers in APAC didn’t see a similar first quarter COVID bump in traffic. However, a similar traffic increase occurred in August, growing 40% from July’s average, as shown in the graph. It isn’t immediately clear what drove that increase, although it could be related to rising coronavirus case counts across the region. Traffic built through the balance of the year, peaking the first week of December, after the Cyber5 weekend activity seen in the rest of the world. This peak was 24% higher than the average over the preceding three months (September-November).
Oh, the places you’ll go…

Among the cohort of travel and hospitality customers, traffic dropped sharply as COVID spread and nations closed borders, falling 77% from its pre-pandemic peak. However, the rate of recovery mid-year is significant, falling just 5% short of its January high. Unfortunately, it is not clear if this increased traffic was driven by a return to leisure travel, people optimistically making plans for future travel, or idle browsing of “fantasy” destinations driven by stay-at-home fatigue. The significant drop in November/December is also interesting, with traffic down 72% from the recovery peak, potentially due renewed stay-at-home orders and travel restrictions due to increasing coronavirus cases in areas around the world.
Kitchens become classrooms

Lockdowns and stay-at-home orders closed schools in the US and around the world, forcing school districts and universities to scramble to move learning online. This shift to online learning is clearly evident in the significant growth seen during March, with traffic peaking 143% higher on March 30 than the average pre-pandemic traffic through January and February. As expected, traffic trailed off into summer vacation. Traffic grew again in August, heading into the 2020-21 school year — while students were able to return to classrooms in some districts/countries, others remained fully remote or pursued a hybrid model, splitting their time between at-home and in-school learning. This partial return to school buildings is reflected by traffic levels in the fall remaining below the spring peak. School vacation periods and long weekends in the US are visible in the graph as well, with the year-end low 52% below the September-November average traffic volume.
Enabling traffic growth
Deploying infrastructure to handle expected traffic growth in a “normal” year generally involves complex modeling, travel planning, supply chain management, and more. However, handling the rapid global traffic growth discussed above presented another set of unique challenges, especially at a time when our infrastructure and deployment teams were grounded. Fastly was well equipped to meet these challenges thanks to the processes and plans we put into place to enable capacity planning and network expansion in a remote-first world. These processes and plans are supported by our ‘Rack and Roll’ approach to POP delivery, which is a scalable, repeatable process that allows us to quickly move from concept to go-live.
Conclusion
2020 was an unusual year — no doubt about it. Through it all, the internet became even more deeply integrated into our lives, serving as a conduit for communication when we couldn’t gather with friends and loved ones, enabling us to shop for food and sundries when we couldn’t get to the stores, and allowing us to lose ourselves for a while in a TV show, movie, or video game. While we were certainly using the internet for these purposes pre-pandemic, traffic trends underscore that usage increased globally as stay-at-home orders were implemented, and that traffic for selected industry verticals continued to grow through the balance of the year. Will 2021 be any less unusual? That’s not clear at this point, though we can be certain that the internet will continue to play a key role, and that the importance of addressing the digital divide will become even more critical.
* Notes on data analysis
The vertical customer cohorts discussed in this post are aggregated based on the customer’s vertical/sub-vertical classification in Fastly’s CRM system. (Note that Social Media & Memes are bespoke collections of Media & Entertainment customers.)
In analyzing the source traffic data, in some cases we have removed anomalous data that is due to single customer events or other factors outside of our control. For the digital media cohorts, total daily GB delivered is used as the traffic metric; for other cohorts, the traffic metric is total daily request volume.
The graphs within the post represent a seven-day trailing average of traffic in an effort to eliminate short-term volatility and help maintain customer anonymity. While some volatility may remain evident in the graphs, our intent is to focus on the overall traffic trends and the likely underlying drivers. Traffic shift percentages cited within the text of the post are calculated from the source traffic data.