
This is the fourth post in a series on Lean Threat Intelligence. Check out Parts 1, 2, and 3.
In Lean Threat Intelligence, Part 3, we showcased a technology that allows you to route messages to and from topics via Kafka. With this setup, it’s straightforward to dip into these different streams to mutate telemetry and logs so it’s parseable and presentable in Graylog.
If you remember the systems diagram, Graylog is the endpoint where logs will be stored. Logs are sent into the Kafka cluster, and either sent to the stream processor and back into Kafka or straight into Graylog. So now that data is flowing, how can you start monitoring and reacting to security events? In this post, we’ll show you a batch alerting strategy that you can use with Graylog and Kafka.
At Fastly, we split the reaction to security events into two separate points on the systems diagram, before and after Graylog. “Before” and “after” alerts allow us to do stream and batch alerting, respectively. Batch searching consumes CPU on the database which is also trying to issue writes asynchronously, while streaming pays that cost continuously. However, stream processing may require overhead to store a sliding window of state for comparisons.
An after alert example could be the aggregation of many searches on Graylog, which are then grouped and analyzed to look for something specific within the correlations of your searches. A before alert example could be looking for a very specific event that needs to be acted on immediately.
For more information, check out the Graylog alerts documentation.1
Creating custom alerters
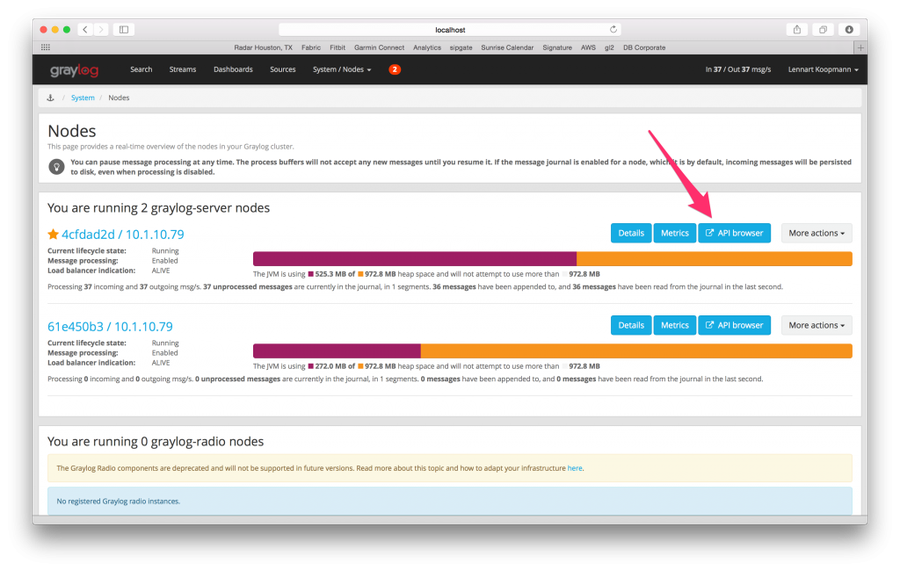
One advantage of having Graylog in your infrastructure is that its web server is a lightweight front end to a large amount of API endpoints.2 This design decision helps people create custom integrations into Graylog, and allows them to query for data and perform the same functionality as the GUI, but programmatically. There are a few bindings for languages out there,3,4 but luckily the interface is in Swagger which makes querying endpoints and creating integrations relatively easy. Accessing the API browser is done in the Nodes window, shown below.2
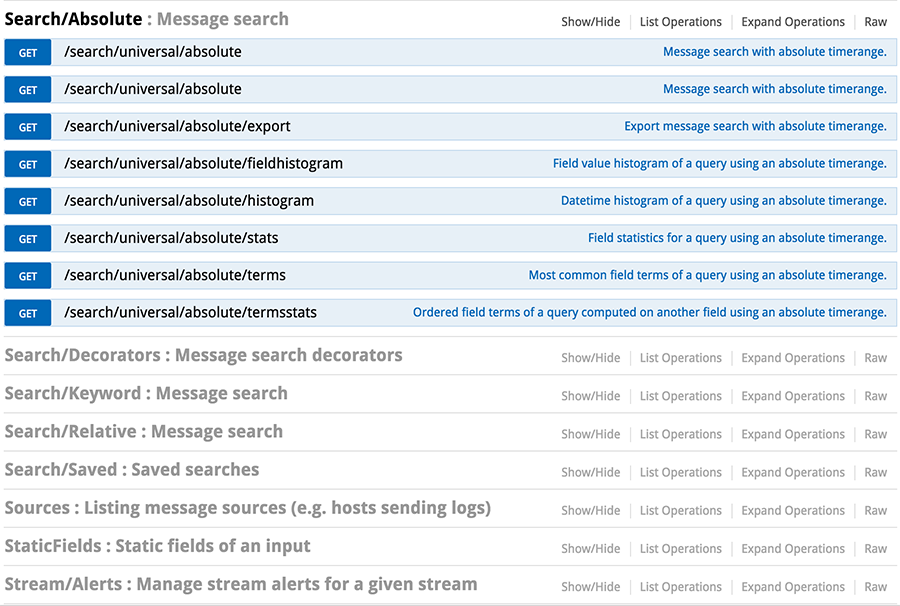
List of endpoints
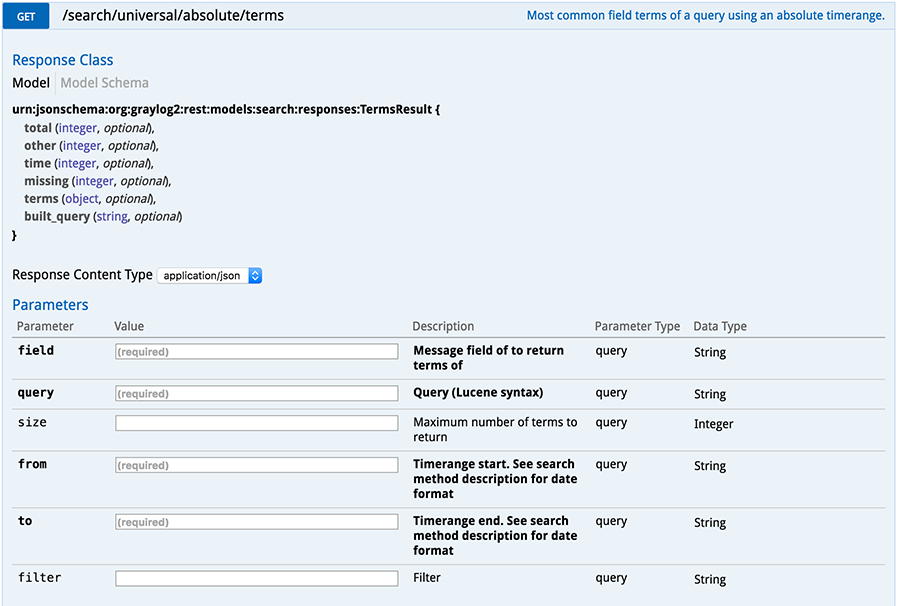
Search/absolute/end endpoint with required fields, HTTP method
As you can see from /search/universal/absolute/terms, Swagger tells us the query it expects, the data types, and what to expect in a response. This is a great endpoint for calculating counts on logs based on a query and a field. For example, a query can be constructed to count all SSH failures against your fleet, and return back the hostname field from that failure to see if an access happened to a machine that should have been firewalled off to the world. Another example is doing a query for all DNS traffic in the last five minutes, asking Graylog to return the destination hostname, and iterating through that list to see if one of the domains is a known DGA either against a Threat Intelligence endpoint or a classifier.
Writing the alerters
Now that you have an endpoint that can do absolute queries for logs and can return things like Terms for counts on specific fields, a series of queries can be constructed and sent to Graylog. The responses can be stored in a script and you can write code to do more complicated analysis.
A use case here includes doing malicious domain lookups. For our purposes, we’ll use the Python, the pygraylog library, and the Bambanek DGA list to perform our lookups.
Assume we have a Graylog instance that records DNS traffic across a network, and each lookup is logged and sent in a format that Graylog understands (JSON). For a list of ground truth of active DGA domains, download the Bambenek List5 for DGAs.
wget http://osint.bambenekconsulting.com/feeds/dga-feed.txt
┌─[zallen@Zacks-MBP]─(~/git/lti4)
└─[15:59]$ ls -lah
total 215864
drwxr-xr-x   3 zallen  staff   102B Sep 20 15:59 ./
drwxr-xr-x  98 zallen  staff   3.3K Sep 20 15:59 ../
-rw-r--r--   1 zallen  staff   105M Sep 19 20:15 dga-feed.txt
Add pygraylog to requirements.txt, drop into a virtualenv and install:
echo "pygraylog" >> requirements.txt; virtualenv env; . env/bin/activate; pip install -r requirements.txtNext, start a Graylog HTTP GELF Input6 so you can send alerts via POST to your Graylog server. With everything in place, you should have the Python library installed, a virtual environment up and running, and an HTTP input to send alerts to Graylog. The following Python gist will query a Graylog server for hostnames queried by DNS in the last five minutes. It will then pull those terms from the response and compare them with the Bambanek DGA list. If a match is found, it will create an alert object and issue the alert to the Graylog POST input.
We will use the source code found in the following gist: https://gist.github.com/zmallen/b5ca9ca75fc788dbd340384c1ac8e022
Fill in your credentials and Graylog credentials at the top with lines 5-6
Then, run the script with python logger.py — this will download the DGA list via the build_data_dict function, compute the last-five-minute window based on Graylog’s time query, and search Graylog by calling search_graylog(). Of course, you can improve this by caching the DGA list to only download daily.
If you want an example fixture, comment out the fixture from lines 32-38, as this will create an alert without querying the server.
Lines 79-81 will then call the alerting function with the results, the time strings, and a reference to the data_dict that we built previously. On line 46, if a term, aka a hostname, is found within our DGA data_dict, then create an alert fixture with some metadata and add that to a list. Once that list is returned, there is logic to see if there is an alert available. If so, send_to_graylog is called and then a message is popped into the POST Input on Graylog. From there, you can set up Graylog to alert on any message coming in on that input, because you know those messages are alertable events. Creating rules to check for keys will save CPU power on stream processing, and you can also create dashboards to help track alerts over time.
Bringing it all together
Fastly employs Python scripts similar to the one above. We have two alerting scenarios in our pipeline, and the above demonstrates the scenario where your team needs to alert on searches that aggregate data. Graylog does have a plugin7 to help with aggregate type alerting, but if we needed to perform multiple searches which group data together then this plugin would not help. Because this is in Python, complicated alerting scenarios can then be represented in code rather than the web interface. It also allows us to have testing, revision control, and continuous integration with our alerting pipeline.
For more on handling security events, check out the upcoming talk on 11/1 from Fastly’s Maarten Van Horenbeeck, Lisa Phillips, and Tom Daly, “Incident command: the far side of the edge,” at O’Reilly’s Security Conference in New York.
References
1 http://docs.graylog.org/en/2.1/pages/getting_started/stream_alerts.html
2 https://www.graylog.org/blog/8-tips-tricks-2-using-the-graylog-rest-api
3 https://www.npmjs.com/package/graylog-api
4 https://pypi.python.org/pypi/bonfire/0.0.6
5 http://osint.bambenekconsulting.com/feeds/dga-feed.txt
6 http://docs.graylog.org/en/2.1/pages/sending_data.html#gelf-via-http