

Back in 2020, an idea surfaced: could we make Varnish request cleanup smarter by only clearing the memory actually used, instead of always wiping the entire block? The theory was that fewer writes to memory means fewer wasted cycles, and at a Fastly scale, that translates into significant performance gains.
But there was a problem. If the bookkeeping was wrong, even slightly, it could leak data from one request to another. This is a risk no developer wants to ship. The idea stayed dormant until we had a way to prove it was safe. This blog will explain how we did just that.
The Old Way: Always Wipe 512 KB
Every incoming request in Varnish receives a 512 KB workspace, split across two 256 KB regions (one for handling the request coming into Varnish, and one for any backend request to the origin). This is essentially a scratchpad for temporary, per-request data. At the end of the request, Varnish cleared the entire region, regardless of how much was used.
It was simple, safe, but expensive. Whether a request used 10 KB or 500 KB, Varnish still zeroed out half a megabyte. At our traffic levels, that meant a mountain of unnecessary memory operations.
The Dormant Idea: High-Watermark Clearing
The optimisation was to track the high watermark, which is the furthest point in the workspace touched during a request.
If the request only used 20 KB, we’d wipe 20 KB, not the full 512. But if tracking was off, un-cleared bytes could persist. That’s a data leak waiting to happen.
The Breakthrough: Focus on the Real Bottleneck
At a recent efficiency summit, one of our engineers from the H2O team built a whole‑system performance model. The results showed that on some AMD machines, memory traffic — not CPU cycles — was the real bottleneck. That shifted the balance: suddenly, high-watermark clearing wasn’t just a nice idea, but something worth pursuing. The challenge was guaranteeing it was safe.
Making It Safe
The hard part wasn’t writing the code, but proving the watermark was always accurate. If we simply trusted the tracking, a missed byte could leak data between requests. But checking every request would have erased the performance gains.
The breakthrough was to use something we already had: workspace integrity checks that run after most workspace operations. By hooking into those and adding random sampling, we could validate correctness without adding constant overhead or increasing Varnish memory traffic unnecessarily. The reasoning was simple: a single machine sampling 1 in 20,000 ops wouldn’t catch much, but across thousands of machines, that’s over a million checks per second. That is plenty to build confidence at scale.
We rolled out watermark clearing in shadow mode:
Still wipe everything – Every request continued to wipe the full 512 KB.
Track usage anyway – Each request also tracked its high watermark as if the optimisation were active.
Sample checks – About 1 in 20,000 workspace ops got audited: everything past the watermark was read back to confirm it had not been used.
To keep overhead low:
We reused existing workspace integrity checks.
We structured the verification loop for SIMD vectorisation, letting the CPU chew through multiple bytes per instruction.
We inspected the generated machine code to confirm the compiler emitted vectorised instructions, not a slow scalar loop.
After running this way across the fleet, we had the statistical confidence to trust watermark tracking. Only then did we enable the optimisation for real.
Rollout and Results
We followed our usual conservative, safety-first rollout, starting with a canary on a few production hosts before expanding across the fleet. The results were significant:
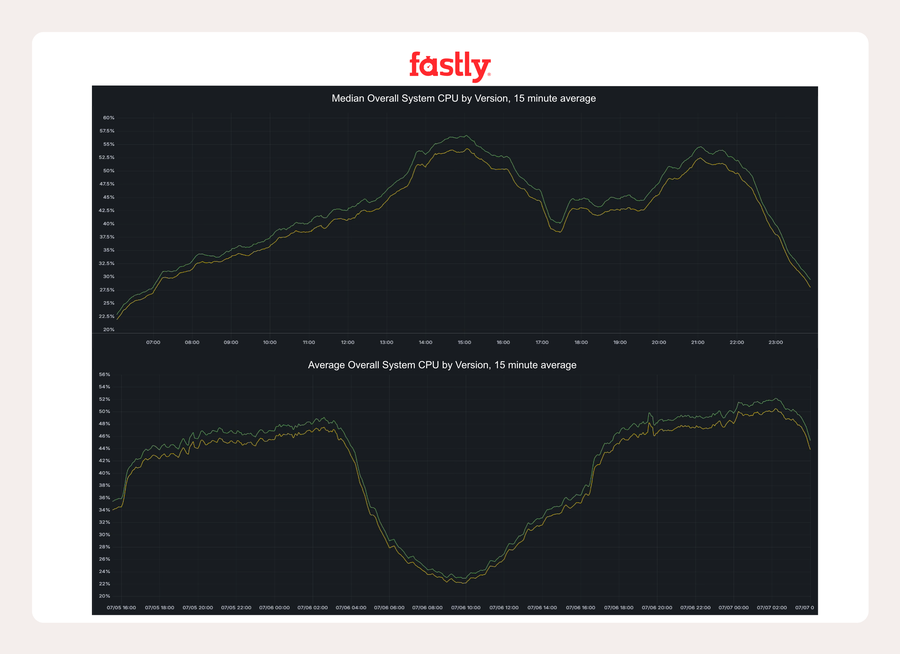
In Marseille, hosts running watermark mode wrote about 10 GB/s less to memory — a 25% reduction in memory writes compared to full clearing. On AMD machines, this was enough to remove memory bandwidth as a bottleneck, unlocking efficiency gains across the stack.
In one busy European POP, system CPU usage dropped by more than 2 percentage points at peak.
In KCGS720, part of the critical IAD metro POP, the reduction was around 1.5 percentage points.
On Intel machines, we were not bottlenecked on memory bandwidth, so overall system usage didn’t move as much, but Varnish-specific metrics still improved.
The ripple effects were striking: by reducing Varnish’s memory traffic, H2O’s instructions-per-cycle (IPC) improved, despite no changes to H2O itself. When you free up memory bandwidth, you give other processes more room to breathe.
Lessons for Developers
Security comes first – An optimisation that risks leaking data is worse than useless.
Be patient at scale – Sampling across millions of ops per second gave us confidence, not guesswork.
Measure the right thing – Memory bandwidth, not CPU, was the true limiter here.
Build on what you have – Reusing integrity checks reduces complexity.
Optimise the optimisation – Vectorised checks made safety affordable.
Expect system-wide effects – Fixing one bottleneck can benefit unrelated code.
Revisit old code – Ideas shelved years ago may be viable with new insights.
Mind the interfaces – Much of the debugging pain lived at the seams between systems.
For developers, the takeaway is this: don’t just chase the obvious CPU numbers. Understand where your system is actually bottlenecked, prove safety at scale, and you can unlock efficiency gains without sacrificing correctness.
Make your code faster and leaner without sacrificing safety. Get started today with a free Fastly developer account.