

At Fastly, we love saying “Cache is King” (first because it is, and secondly because we are all big fans of efficiency!) We love cache efficiency. Efficient caching can bring huge improvements to performance, security, resilience, cost savings… the list goes on. The less your origin servers need to be contacted, the better. And that matters a lot to users visiting your website or app - it should be instant, snappy, and efficient - which means managing the load on your servers is a priority.
What is request collapsing?
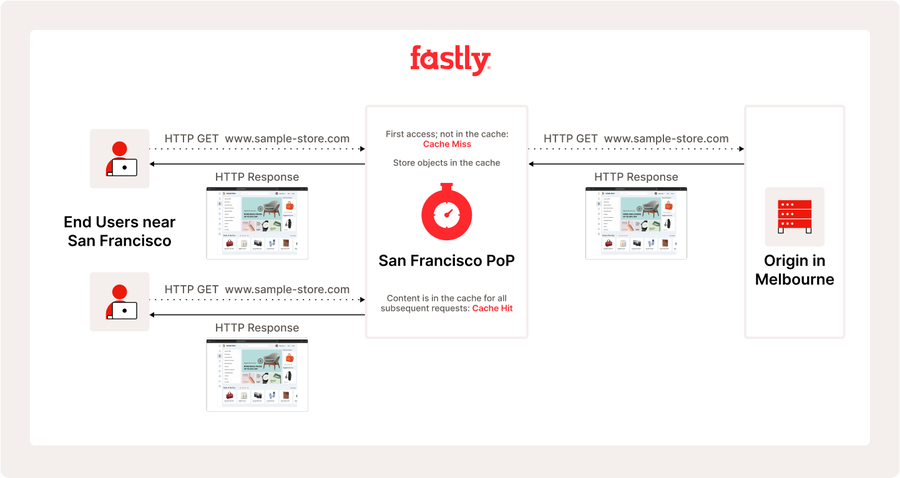
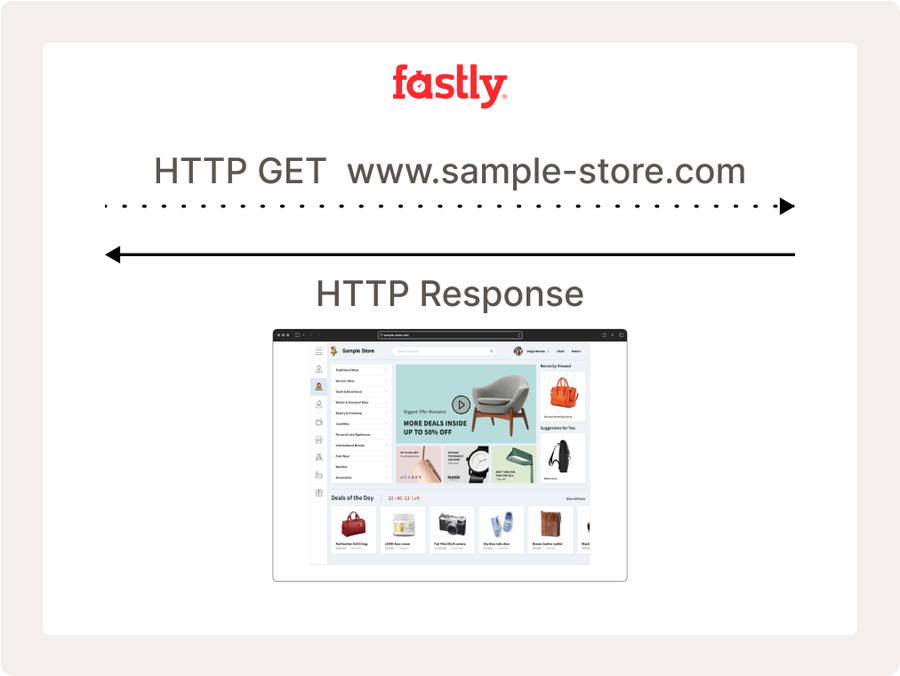
One of our platform's “superpowers” that contributes to efficiency is request collapsing, the practice of combining multiple concurrent requests for the same object into a single request to origin and then using the resulting response to satisfy all pending requests. To better understand what this accomplishes, let’s take a closer look at a basic cached response:
Easy and efficient, right? But each step in this process will need to take time, so let’s take an even closer look:
So far, so good! But what happens when a surge of users all want the same thing at the same time - but we haven’t been able to fetch it from your origin? This happens all of the time during live video streams or new game releases. That’s where request collapsing occurs. Fastly’s architecture and caching platform let us use the same origin response to serve requests that arrived after we started fetching it. This means all of those requests get the freshest response possible without additional fetches from origin. Users get fresh content (and have a good experience), your origin is protected, and best of all, it’s very efficient.
When can request collapsing happen?
In our previous example, we saw how request collapsing is a powerful subset of Fastly’s caching behavior. It’s always enabled by default, and there’s nothing special you have to do to take advantage of it. That said, it is a situational behavior that requires certain things to occur within very short timeframes, and not all customer workflows can benefit from it.
First, the requests must be cache interactive, meaning that they will produce a cache object that subsequent requests can use. PASS requests and many errors are uncacheable by default, which means that we will never be able to successfully collapse those requests. If we can’t cache it, we won’t be able to collapse requests on the response.
Second, to collapse requests they must be concurrent with the request that initiated the fetch from origin. This means that we receive the request while we are already fetching it in order to satisfy an earlier request. Once that response completes, normal caching behavior takes over, and collapsing stops. This most commonly happens on cache objects that change frequently and are very hot, so lots of users want them at the same time and we have to fetch them from origin frequently.
Concurrency is going to be increased by features like clustering and shielding. Both of these concentrate requests within our platform in order to improve efficiency and performance. You may also see a higher occurrence of request collapsing when an origin takes longer to respond, either because the object is larger or the origin is overloaded. Because the period of time in which we are waiting for the response is longer, there is more time for requests to collapse on it.
Somewhat counter-intuitively, faster origins and features that improve time to first byte will reduce how often we can collapse requests. As explained above, we will only collapse requests while we are waiting for the response from origin. Once the response is ready for us to use, we stop collapsing. Enabling the streaming miss feature can reduce this window significantly, as the feature lets us start using the cache object as soon as we receive the headers for the origin response.
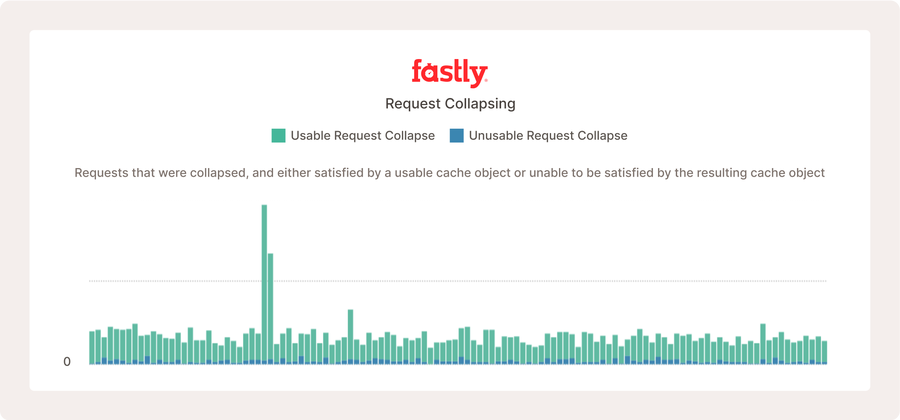
The above shows a portion of the media shield dashboard for a popular live video service. Request collapsing is occurring, but because the origin is fast and the configuration is so efficient, it doesn’t happen very often compared to the number of requests it receives.
Request collapsing metrics
Now that we have a better understanding of what request collapsing is and what it does, let’s explore the metrics that you’re going to want to keep an eye on. These metrics will help you understand if it's working (or not!) and how effectively it is operating.
We’ve introduced two metrics that are available in both real-time and historical statistics right now:
request_collapse_usable_count
request_collapse_unusable_count
Our customers can find these metrics via our APIs or you can use a custom panel to view them within our Observability and Media Shield dashboards. To go into more detail:
Usable_count: counts how frequently we collapsed requests and found a usable cache object. In order to be usable, the object must be cacheable and have a positive cache lifetime. Cache lifetime is the object’s time-to-live (TTL) minus its Age (how long we’ve had it in cache). Once an object’s cache lifetime is no longer positive, it expires and is no longer valid for any cache usage except for delivering stale content. Cacheability is also governed by the beresp.cacheable variable and is documented elsewhere.
Unusable_count: is the opposite of the above - usable_count. When a response is unusable we have to try to fetch it again from origin. Generally, this is bad and could mean that there’s a configuration issue either with your origin, your service, or that you have an uncacheable workflow that isn’t being PASSed. (Adding these two together tells you how frequently requests are being collapsed!)
Understanding request collapsing metrics
Almost there! We have dashboards to check out how your traffic is behaving within our platform, and you know what to look for – but there’s also a lot of new numbers to manage… what’s good? What’s bad?
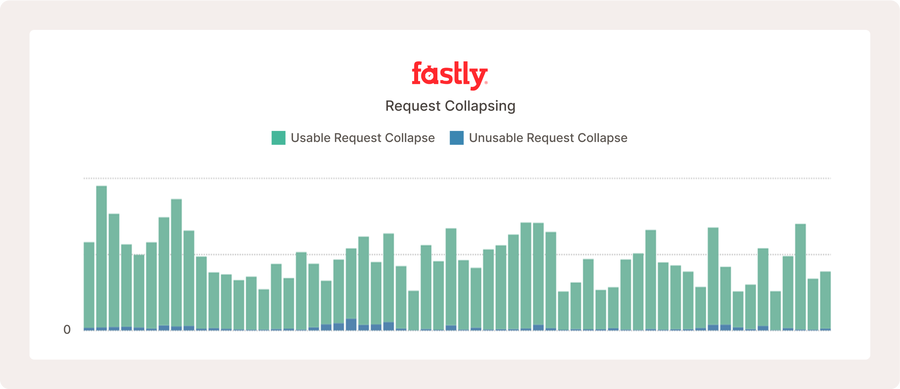
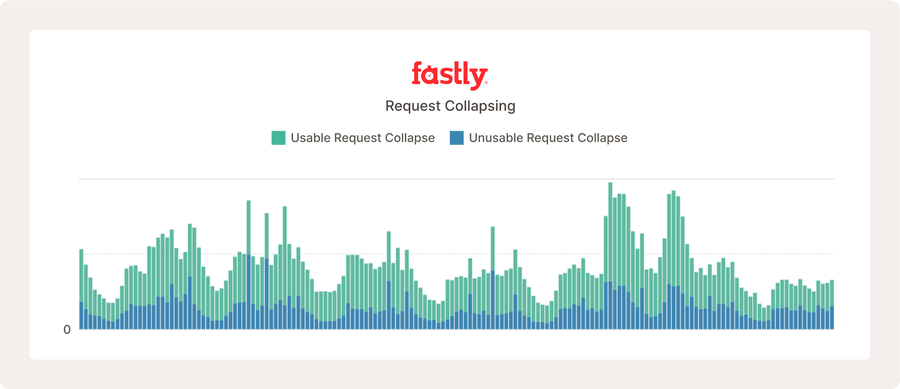
The above shows request collapsing metrics for a very busy open source project, in which many users poll for new content regularly, which increases how often request collapsing happens.
To understand what’s working and what’s not, you first need to have a foundational knowledge of your users’ traffic patterns. Request collapsing is unlikely to happen if your requests are spread over a large number of URLs that don’t change very often. It’s important to remember that the majority of request collapsing happens to requests arriving within the same 25 - 150ms of each other. That is a very small window of time. Certain workflows are much more likely to experience benefits from request collapsing. News sites, live video streams, and popular file downloads are likely to see request collapsing happen much more often. It all depends on how many users request the same object at the same time.
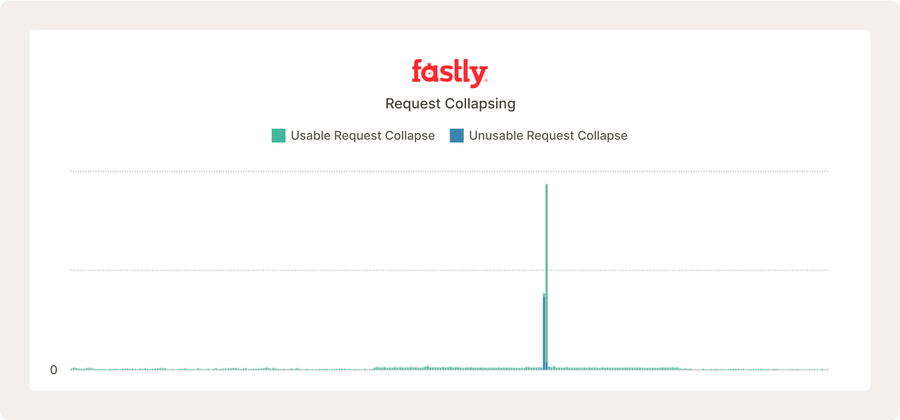
In the above sample of a real website, request collapsing doesn’t often occur until there’s a sudden spike in traffic for the same cache objects.
It’s important to stress that lower or higher volumes of request collapsing is neither good nor bad. This isn’t a metric that you need to be concerned with increasing or decreasing, with an exception (more on that in a moment!). What it is showing is how often we’re serving users directly from your origin at the same time. A good rule of thumb is to consider how high these counts are compared to your overall request volumes. It’s entirely normal for there to be small amounts of request collapsing with an unusable result. This is because many backend errors aren’t cacheable, and occasionally, user behavior can cause us to request an object at just the right time so that it has expired by the time we receive it. This is entirely expected.
Lots of unusable responses can look problematic, as shown above. However, this website serves over ten million requests each hour, and what we’re seeing is normal internet behavior due to legitimate error responses, which are uncacheable.
Back to that caveat I mentioned, one thing you should be very aware of (and reach out to your Fastly Rep if you see it occurring) is if you have high volumes of unusable counts when compared to your request volumes. This is a potential indicator of request serialization. We’ll discuss that in much further detail in a future blog, but briefly, request serialization means Fastly is trying to fetch an object to satisfy multiple requests at once, but the response isn’t able to create a valid cache object. When this happens, the initial request gets the unusable object, and the next request tries again. If this keeps happening, we will only respond to one request at a time, over and over. This is very inefficient and can lead to some real user impact.
Another tricky thing about these metrics is that they can’t indicate whether requests are collapsing on a few very hot objects or a large number of only mildly hot objects. This is important because high volumes of unusable objects spread out may be entirely normal for your workflow. Request collapsing can be a complicated topic, but if you have made it this far, we hope that you found this informative on your efficiency journey. We plan on covering this topic in further detail in future blogs. Stay tuned!