

Have you noticed the recent enhancements we’ve made to the “Billing” section of the Fastly Control Panel? We’ve been hard at work, meticulously redesigning the entire section with customer empowerment and transparency in mind. Starting with all-new Billing overview and Plan usage pages! These additions reflect Fastly's commitment to delivering a seamless user experience, allowing customers to navigate their consumption data and optimize their operations efficiently.
Whether you're looking to delve deep into your month-over-month expenditure, scrutinize usage by product line, or forecast future usage, these robust tools ensure you have the insights to make informed decisions in an ever-changing digital landscape. And we’re just getting started!
Simplified Billing dashboard
The new Billing overview page (found in the Fastly Control Panel) is a comprehensive dashboard that offers a granular and historical perspective of your financial and resource utilization. It’s designed to help you, not only track, but also analyze your spending and usage patterns across different services and regions, month-to-month.
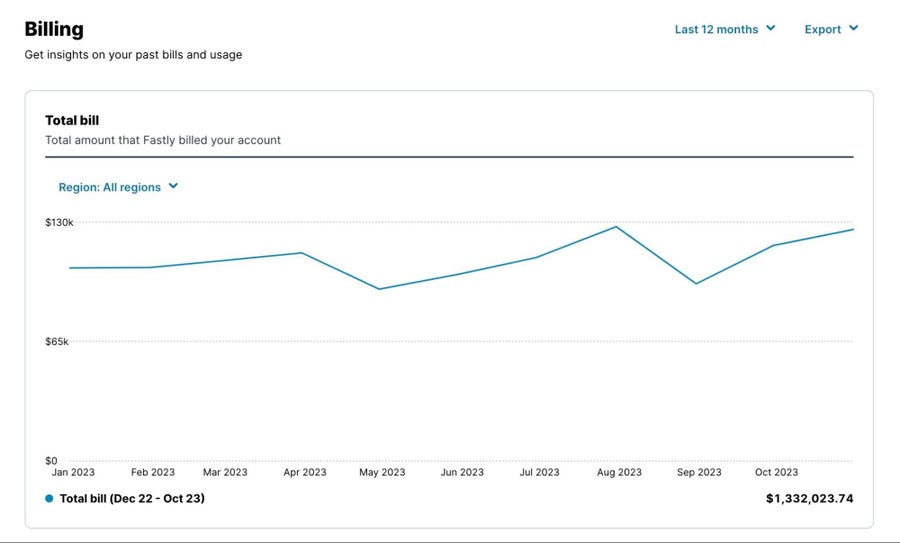
Starting with the "Total bill" section, you’ll see a line graph that captures the total amount billed to the account over the last 3, 6, 12, or 24 months. You can immediately notice trends and fluctuations in your spending, enabling you to identify any atypical changes or to verify the impact of scaling operations on costs.
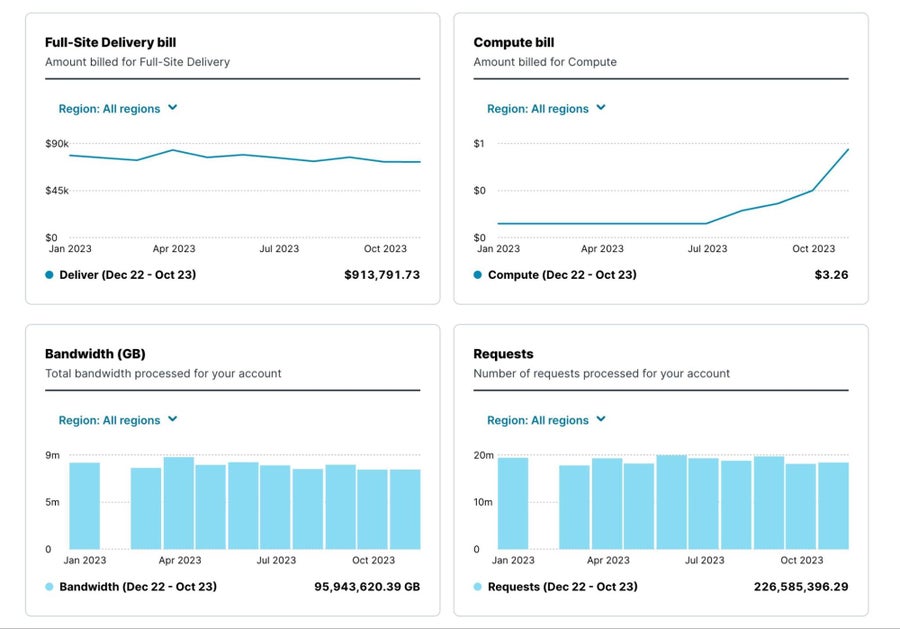
Below, you’ll find a breakdown by product line giving users a focused view of specific cost drivers. For instance, a spike in the "Compute bill" could reflect a surge in processing needs, while a steady "Full-Site Delivery bill" would likely indicate effective and consistent content delivery.
Additionally, the "Bandwidth" and "Requests" bar graphs provide a clear visual of the volume of data transferred and the number of requests processed, respectively. This data is crucial to correlating spending with the consumption of network resources.
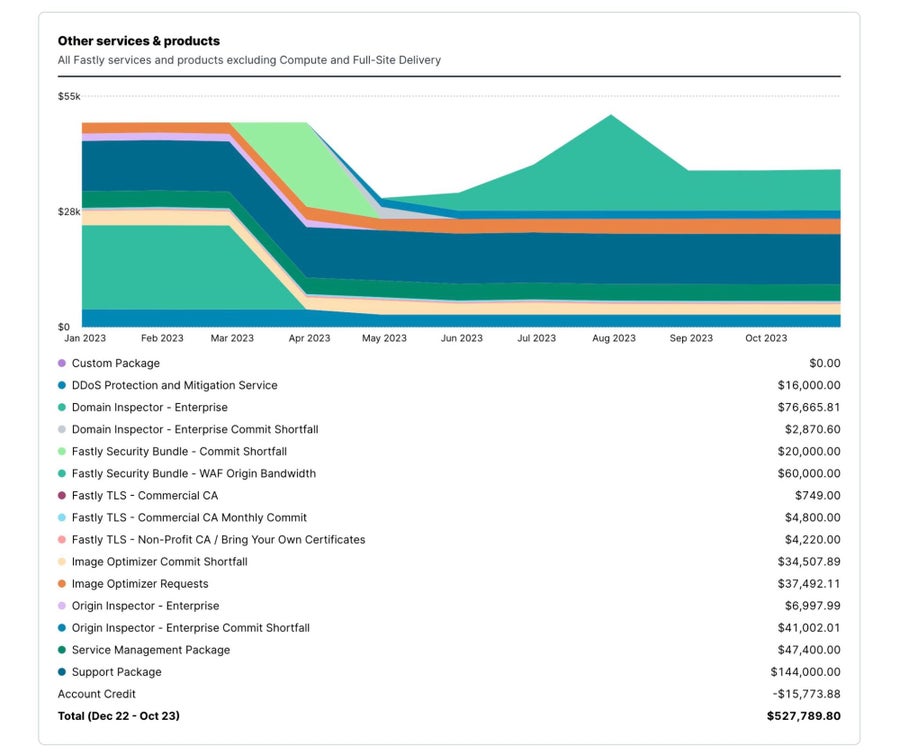
The "Other services & products" section offers a stacked area chart that shows the costs associated with various Fastly services and products over time. This detailed breakdown by product line helps you pinpoint specific services that may be contributing disproportionately to your bill, allowing users to evaluate the return on investment for each service.

Lastly, the "Regional bills" stacked area chart is an essential feature for global businesses, as it breaks down the billing information by geographical region. It helps customers see which regions are incurring the most costs, which can inform budget allocation or indicate where market engagement is highest.
Track Plan usage with ease
The all-new Plan usage page offers you a clear and detailed view of your service consumption over time, again, providing insights that are critical for managing resources and costs effectively.
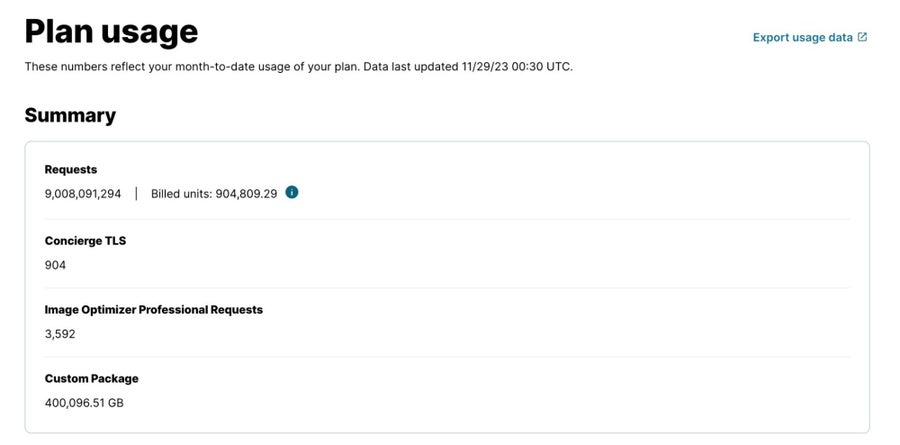
At the heart of the new page is the summary section, which consolidates crucial usage metrics into a snapshot view. It shows the total number of requests and the corresponding billed units, immediately alerting users to their current expenditure against their plan. The inclusion of bandwidth data further enhances this overview, allowing users to correlate request counts with the volume of data transferred, giving a fuller picture of their usage patterns.
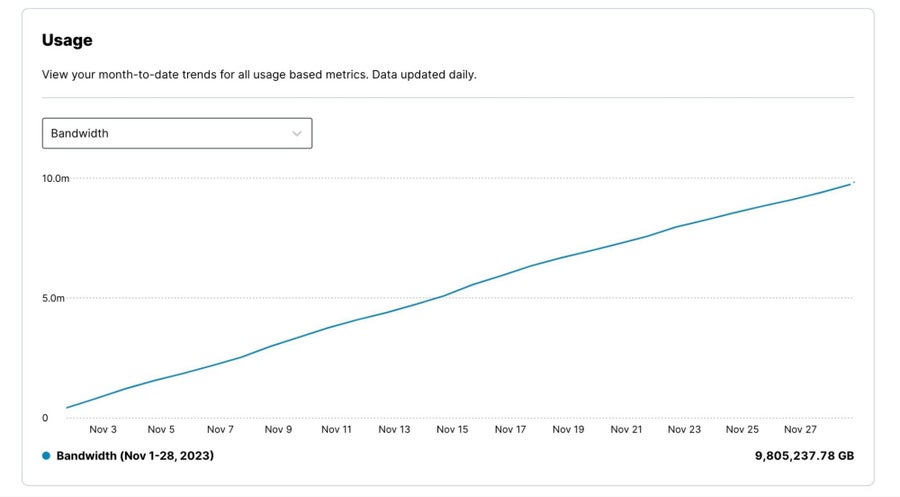
The usage trends are visualized in a line graph, just below the summary, that tracks the number of requests over a specified period. This graphical representation makes it easy to spot trends at a glance. For instance, a steady incline in the graph could suggest a successful marketing campaign or an increase in customer engagement, while a decline might prompt a review of recent changes or potential issues.
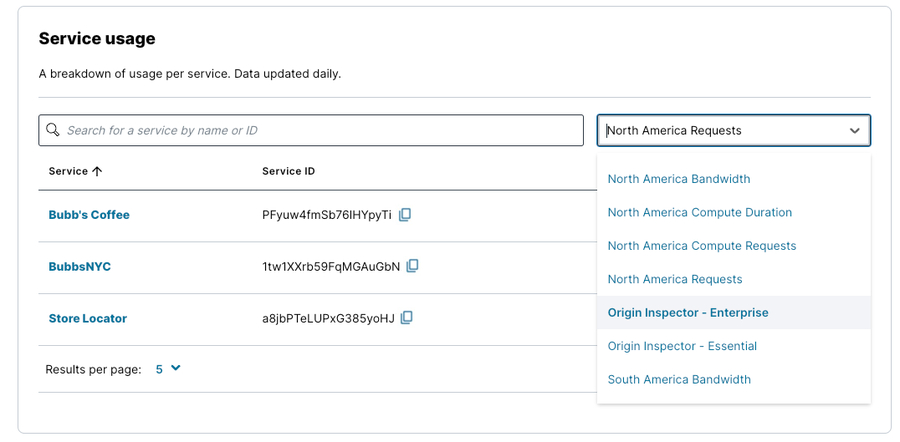
Going beyond account-level usage, we’ve also provided a breakdown of service-level usage. Here, you can sort your services by usage metric allowing for immediate visibility into which services are most active.
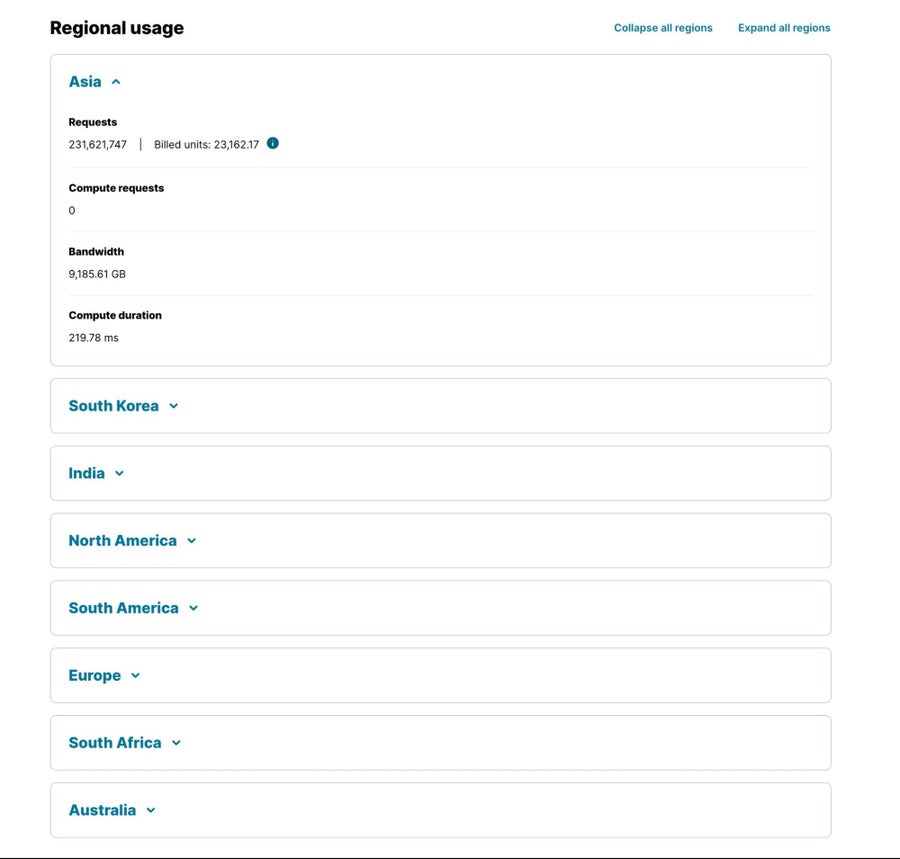
At the bottom, users are provided a "Regional usage" section that provides a granular look at usage data, broken down by geographical regions. This regional breakdown is crucial for businesses operating in multiple markets, as it can inform decisions on resource allocation and identify regions with higher or lower engagement.
Overall, the new Plan usage page is a comprehensive tool that not only delivers essential information on current usage but also equips customers with the data needed to forecast future needs, budget effectively, and strategize for growth. It enhances transparency and control, allowing customers to make informed decisions with a long-term perspective on their service consumption.
Looking forward
Our commitment to enriching the user experience throughout the Fastly Control Panel shines through with our latest updates to the Billing section, ensuring that every customer has the means to monitor, analyze, and optimize their digital operations with precision and ease. And our enhancements won’t end there. Be on the lookout for more features, refinements, and capabilities coming soon!