
About the Custom Dashboards page
The Custom Dashboards page is where you access Observability dashboards that you've customized. You can customize dashboards to include metrics for a service to make them more visible and accessible in a single location.
Before you begin
Be sure you know how to access the web interface controls before learning about the details you'll encounter here.
Limitations and considerations
Keep the following things in mind:
- Only users assigned the role of superuser or engineer can edit custom dashboards, but all account users will be able to view them.
- By default, you can add and view metrics for Historic Stats in custom dashboards. To add and view metrics for Origin Inspector and Domain Inspector in custom dashboards, you must purchase an Observability package.
About the Custom Dashboards page
The Custom Dashboards page provides a list of clickable links to all custom dashboards you've created. You can view a complete list of custom dashboards associated with your account, including the name of the user who created them and the last date on which each was updated. To access this page, go to Observability > Custom dashboards.
Clicking on each column in the displayed list will sort the entire list based on that content type. You can use the search box to search for a specific dashboard by name. You can also filter dashboards based on which user created them by selecting that name from the Created by menu.
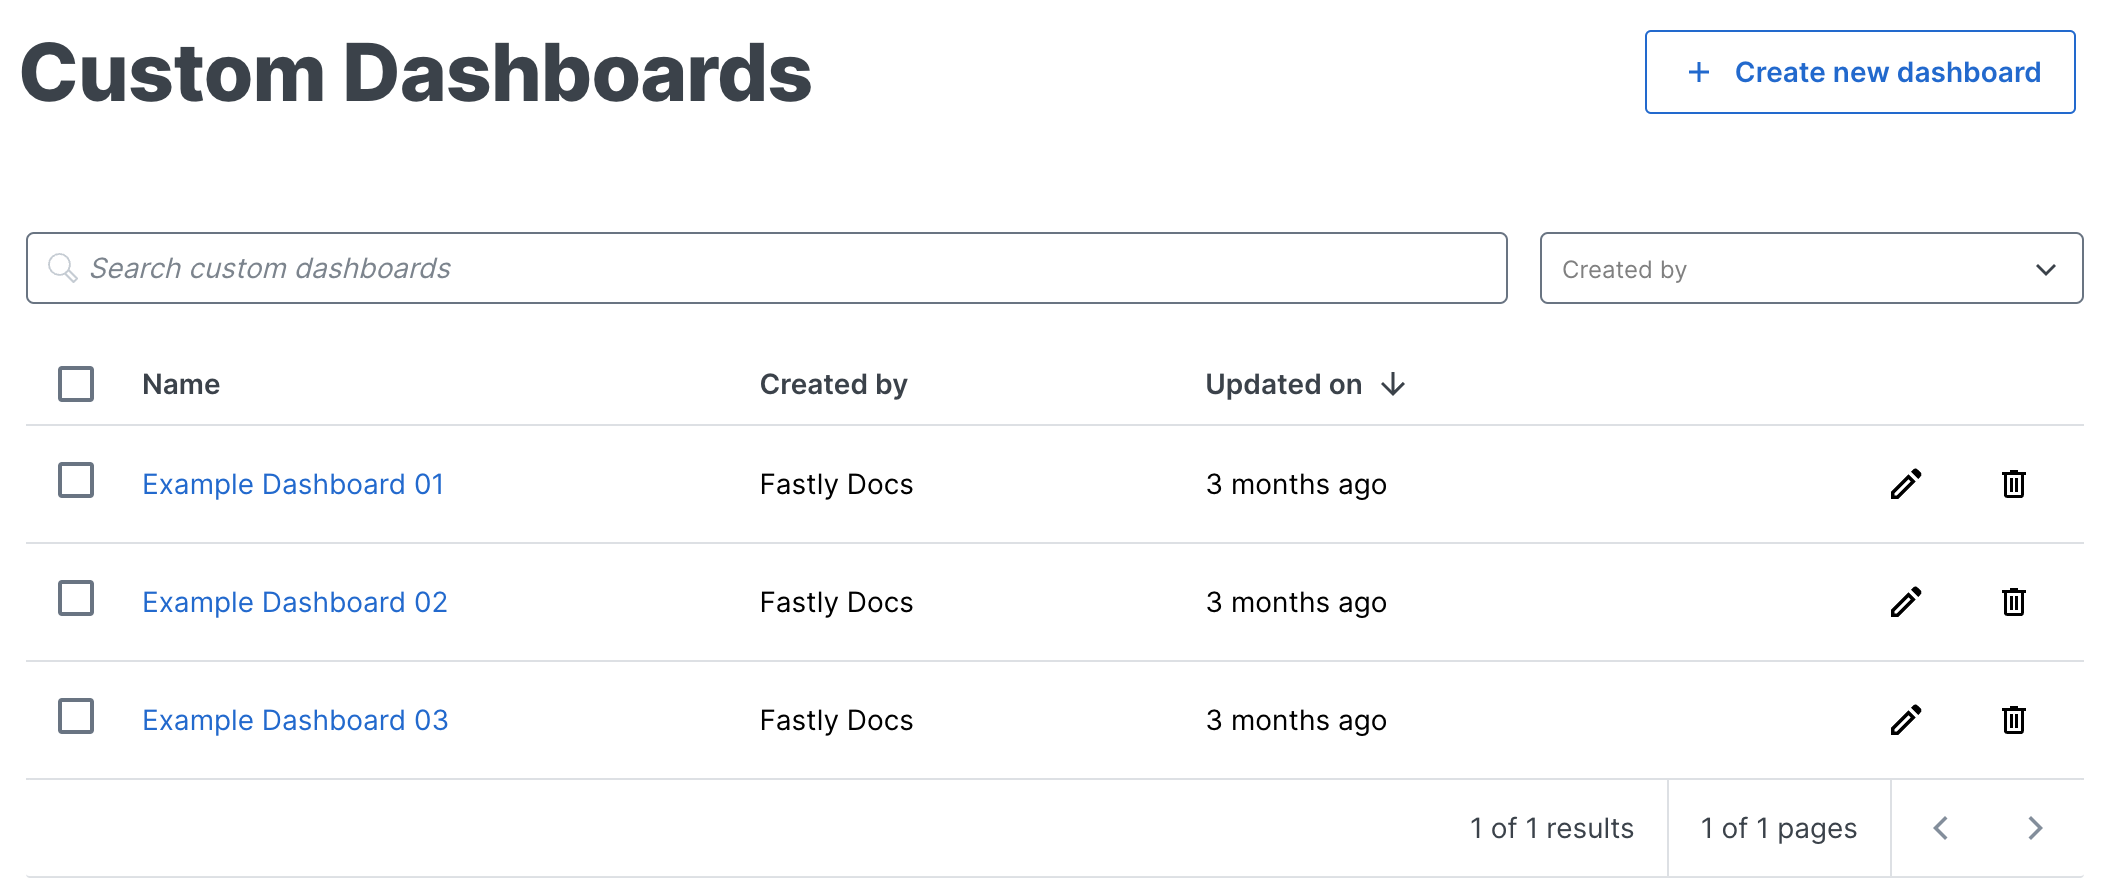
Clicking Create new dashboard above the dashboard list takes you to the Create Dashboard page.
What's next
Dig deeper into details about all areas of the web interface before you move on to working with services.
