Monitoring signals
The Next-Gen WAF tags requests with signals, which are labels that describe notable request properties. You can use these signals to help monitor and understand traffic processed by the WAF.
Monitoring corp (account) signals
To get a high-level view of the top signals your requests are tagged with for a specific corp (account), follow the instructions for your control panel below:
- Next-Gen WAF control panel
- Fastly control panel
You can use the Top Signals section of the Corp Overview page to monitor top signals for a corp. To monitor corp signals, click the name of your corp in the upper left corner of the control panel to navigate to the Corp Overview page. The Top Signals section surfaces signal data from your corp in the following tables:
- Attack Signals: displays data related to malicious requests.
- Anomaly Signals: displays data related to abnormal requests (e.g., requests containing malformed data and requests originating from known scanners).
- Corp Signals: displays data related to signals created at the corp level.
You can use a search bar to filter the tables by signal. The tables contain the following columns:
- Signal: the name of the signal.
- Total Requests: the number of requests that were tagged with the signal in your corp.
- Top sites: the sites that had the highest number of requests with that signal.
- Requests per Site: the number of requests tagged with that signal per site.
Monitoring site (workspace) signals
You can monitor signal activity for a specific site (workspace).
- Next-Gen WAF control panel
- Fastly control panel
IMPORTANT: The Signals Dashboards page is not available for the Essential platform. On the Essential platform, you can monitor signals for a site via the Signals page.
The Signals Dashboard page lets you view charts that display time series data for all signals for a specific site. To access the Signals Dashboard page:
- Log in to the Next-Gen WAF control panel.
- From the Sites menu, select a site if you have more than one site.
From the Monitor menu, select Signals Dashboard.
(Optional) Click the name of a signal to view a summary of the activity related to that signal.
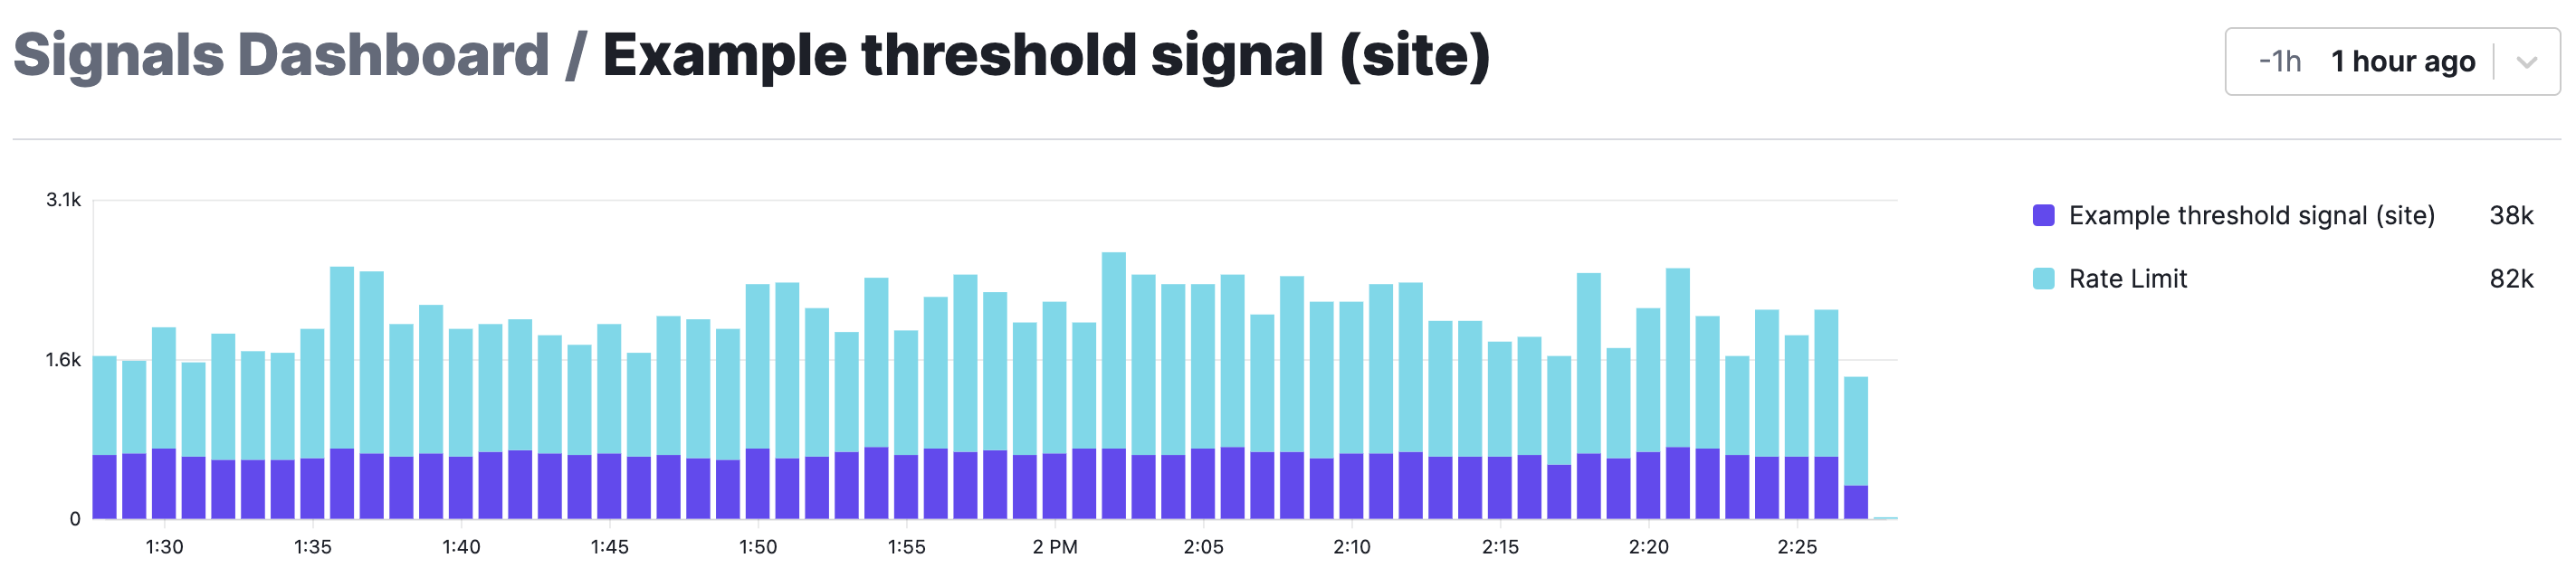
When a signal acts as the threshold signal for an advanced rate limiting rule, the summary page includes a chart that shows two key metrics: the number of requests tagged with the threshold signal and the total number of requests that were rate limited. Because the total number of rate limited requests already counts requests tagged with the threshold signal, these numbers should not be added together. For example, if both the threshold signal count and the rate limit count are 1, the request tagged with the threshold signal was the one that was rate limited. However, the counts may not be the same if the rule rate limits all requests from clients exceeding the threshold. For example, if approximately 38,000 requests were tagged with the threshold signal and 82,000 requests were rate limited, nearly all requests tagged with the threshold signal were rate limited, and approximately 44,000 other requests were rate limited.