


Key Findings
Halftime bandwidth dropped by an average of 24.65%, with the largest observed decline reaching 34.13%
Portugal's opening match produced the highest traffic peak in the dataset through June 22, exceeding Argentina's debut by more than 30%
Earlier matches in the daily schedule generally attracted higher peak bandwidth than later matches, while no clear weekend viewership boost emerged
Close, competitive matches tended to generate larger second-half traffic surges than one-sided contests, with several matches recording second-half peaks more than 30% above their first-half peaks
Fastly powers some of the world's largest live events, where performance and reliability are tested at a massive scale.
One of the most exciting parts of working at Fastly is being part of events that captivate the world. Events that grab the attention of hundreds of millions, and potentially billions, of people worldwide. Whether it's breaking news or a global holiday, few events can command the collective attention of the world like a sports championship.
For many years, Fastly has been a key part of major sporting events. We’re there, powering moments that matter, and seeing truly world-scale trends.
The World Cup is on an entirely different level. Few sporting events capture global attention on the same scale, creating an exceptionally large worldwide audience. That demand is reflected in the number of broadcasters and streaming providers carrying each match across markets around the globe. Unlike many other major sporting events, such as March Madness or the Olympics, the schedule also features relatively little overlap between matches. That makes it easier to isolate viewership patterns and identify meaningful trends in the data.
In short, this is the sporting event with a large demand sample, a broad number of outlets (enabling more reliable measurement), and a low level of cross-event overlap that can muddy the data. It’s an amazing insight into global population trends.
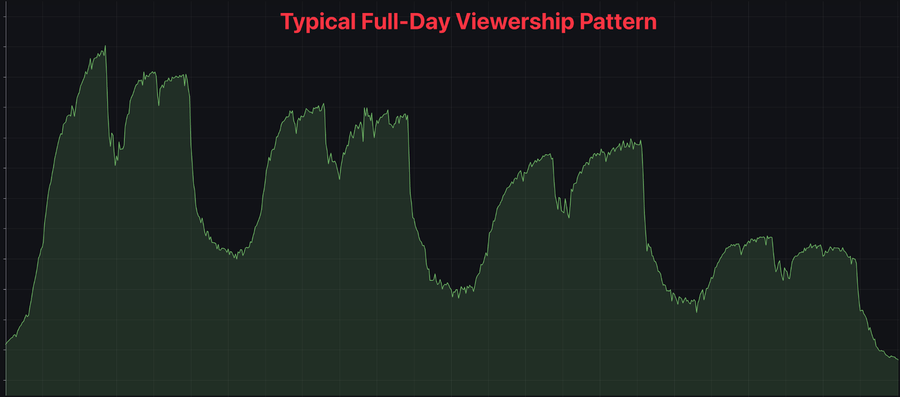
Although the tournament has now moved into the knockout rounds, this analysis is based on traffic we saw across the global Fastly platform, focusing on 2026 World Cup match windows through June 22, capturing the group stage (excluding France v. Iraq on June 22 due to a rain delay that disrupted normal viewership patterns).
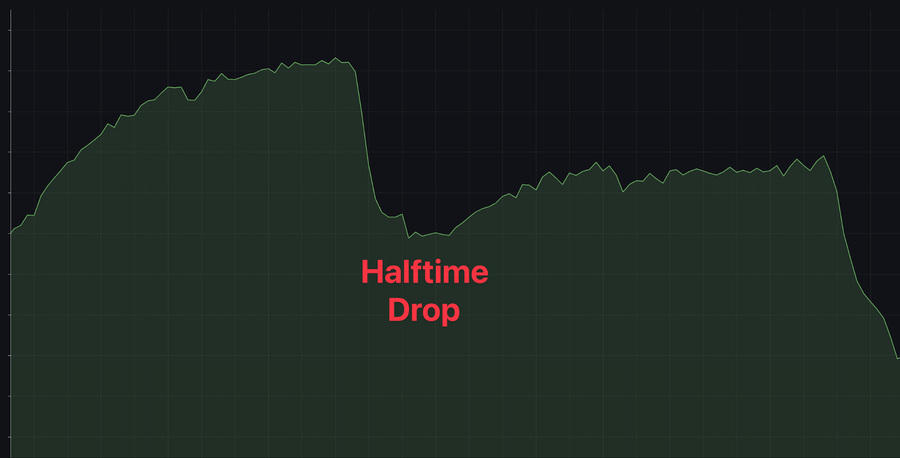
Halftime: Up to 34% dip in bandwidth
With World Cup half-time being roughly 15 minutes, it’s reasonable that some viewers may close their app, change the channel, or otherwise end their broadcast feed. But, by how much?
Based on our data, there is a 24.65% average dip in bandwidth during halftime (standard deviation 4.22%). This could be linked to viewers temporarily changing channels, switching apps, stream fluctuation or otherwise ending their broadcast feed. The single match with the largest sports streaming halftime dip was Norway v. Senegal at 34.13%.
Star power: Do celebrity players bring the viewers?
This was a difficult hypothesis to test. The concept of celebrity is nebulous and really very difficult to quantify. The way we started to look at this is with the quintessential GOAT debate between two of the most beloved players on the current World Cup rosters: Messi and Ronaldo.
By that quick comparison, the data turned out to be clear. The most popular match we’ve measured to date by traffic peak is Portugal’s debut against the Democratic Republic of Congo.

Compared to Argentina’s debut against Algeria, Portugal’s debut peaked over 30% higher. Argentina was not even the highest-traffic match of its broadcast day (that honor goes to France v. Senegal).

In regard to the sport and skill GOAT debate, we’re not going to wade in. But regarding the viewership GOAT: the data seem to indicate that Cristiano Ronaldo stands far above the rest. No other match appeared to have an outsized volume of traffic potentially linked to a celebrity player, as with Portugal’s debut.
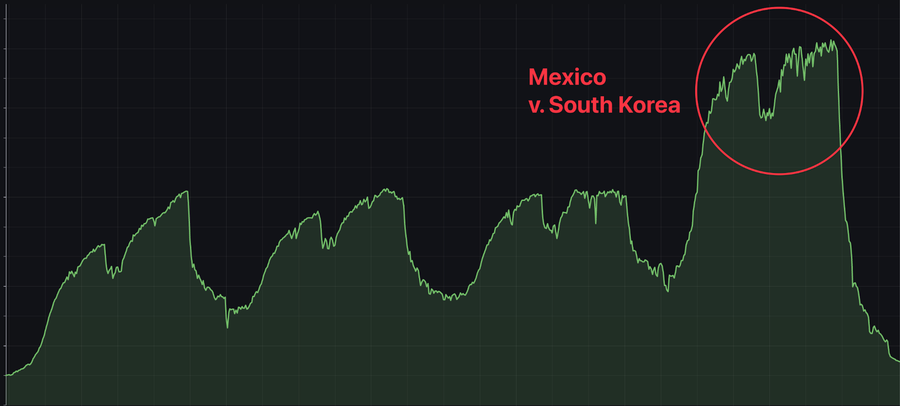
Does the time of day or day-of-week matter?
Across the group stages, with up to four matches per day, we do see an interesting trend in viewership: earlier matches get more views, with the top match by bandwidth tending to be the first or second of the day.
A notable exception: June 18th. On that day, Mexico v. South Korea defied the trend and became the highest-bandwidth match. From the information we have, it is unclear why this match broke with the trend, but that deviation is noteworthy.
As for weekdays or weekends? There’s no clear evidence of a “weekend boost.” At the time of measurement, 8 of the top 10 and 4 of the top 5 matches by peak bandwidth happened during North American weekdays. Controlling for 5 weekday days v. 2 weekend days, there’s no strong signal that the World Cup takes any days off.
An interesting note: of the top 10 matches so far by peak bandwidth, only two countries have been represented twice (Argentina and Mexico). Football is truly a global sport. However, the match count in our sample size is too small to drive real conclusions – we’ll keep measuring and monitoring through the tournament.
The Real Question: Does good football make a difference?
The short answer to this question is: yes, obviously. Exciting matches, strong teams, and great performances drive traffic at the start of matches, and can result in traffic surges towards the end.
Let's dig into that second statement a little more. Do close matches drive traffic at the end? Is there a “come watch this” or “you need to see this” pile-in effect? Based on the information we have, yes, this happens, and it can be quite substantial.
As a baseline, a match that is still competitive but with a 1-goal lead and relatively equal control typically sees an increase of ~5% from the first-half peak to the second-half peak. “Blowouts,” where a team has a 2-goal lead and lopsided control, see a subtle but noticeable traffic decrease from the first to the second half. We can dig into this data more in a future post.
But close, “nail-biting” matches? They explode. Let's take a look at the Spain v. Cabo Verde match (shown at the left alongside the next match for comparison), which unexpectedly ended in a draw.
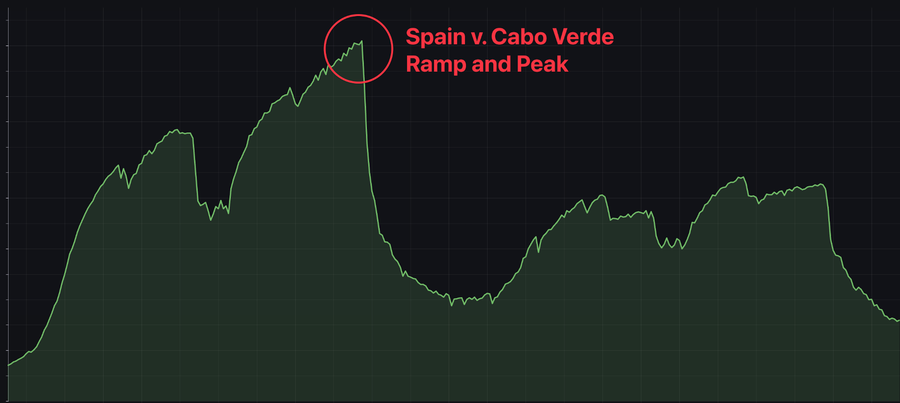
Half-over-half, the match saw a nearly 33% increase in peak bandwidth, with a huge surge tuning in during the second half.
Each scheduled break seems to trigger a “decision point” where exciting matches start to see a steep ramp, and less-competitive matches see a small drop-off. Again, calculating drop-off would be the topic of another post. But when looking at match scores, their late-second-half performance, and their half-over-half growth, there are some interesting findings. In addition to Spain v. Cabo Verde’s jump above:
Ecuador v. Curacao ended in a scoreless draw and saw a 17% peak over the match’s first half high.
Uruguay v. Saudi Arabia, a highly competitive match with a goal at the 80-minute mark to tie the match, saw an 18% peak at the end of the match over the first half high point.
Czechia v. South Africa, with a goal at 83 minutes to tie the match, saw a 33% spike over the first half.
Switzerland v. Bosnia and Herzegovina, which was scoreless at the second hydration break despite the lopsided final score, ultimately saw its traffic ramp 12% at the end of the match compared with the first half.
Germany v. Ivory Coast, which was tied midway through the second half, ramped 13% from the first half by the end of the match.
Overall, there are numerous variable details that can impact a match’s traffic, so it’s difficult to say that the second hydration break, a planned stoppage of the match where all fans can potentially log in to social media or text friends to hype the quality of a match, is truly responsible for this type of spike over previous World Cups, but it’s definitely interesting.
Let us know what we should investigate next!
As the tournament continues into the knockout rounds, we're excited to see how these trends evolve. If you have burning questions that you'd like us to dig into through the rest of the tournament, let us know on socials. Elimination rounds, impact of popular teams and populous countries, more analysis of halftime? We’re all ears.
We see the world; we can be your industry partner
Of course, none of this would be possible without the partnership and support of our customers, who power some of the largest and most popular global events. We've been grateful to support events like these throughout Fastly's journey. Every year, the number of people who enjoy live sports, navigate global commerce, and engage with the modern, agentic, and digital future continues to grow.
If you would like your systems to be more performant, more secure, and ready for global scale, drop us a line. We do this all day, every day, and we'd love to be a part of your success as well.